backtest-kit api reference
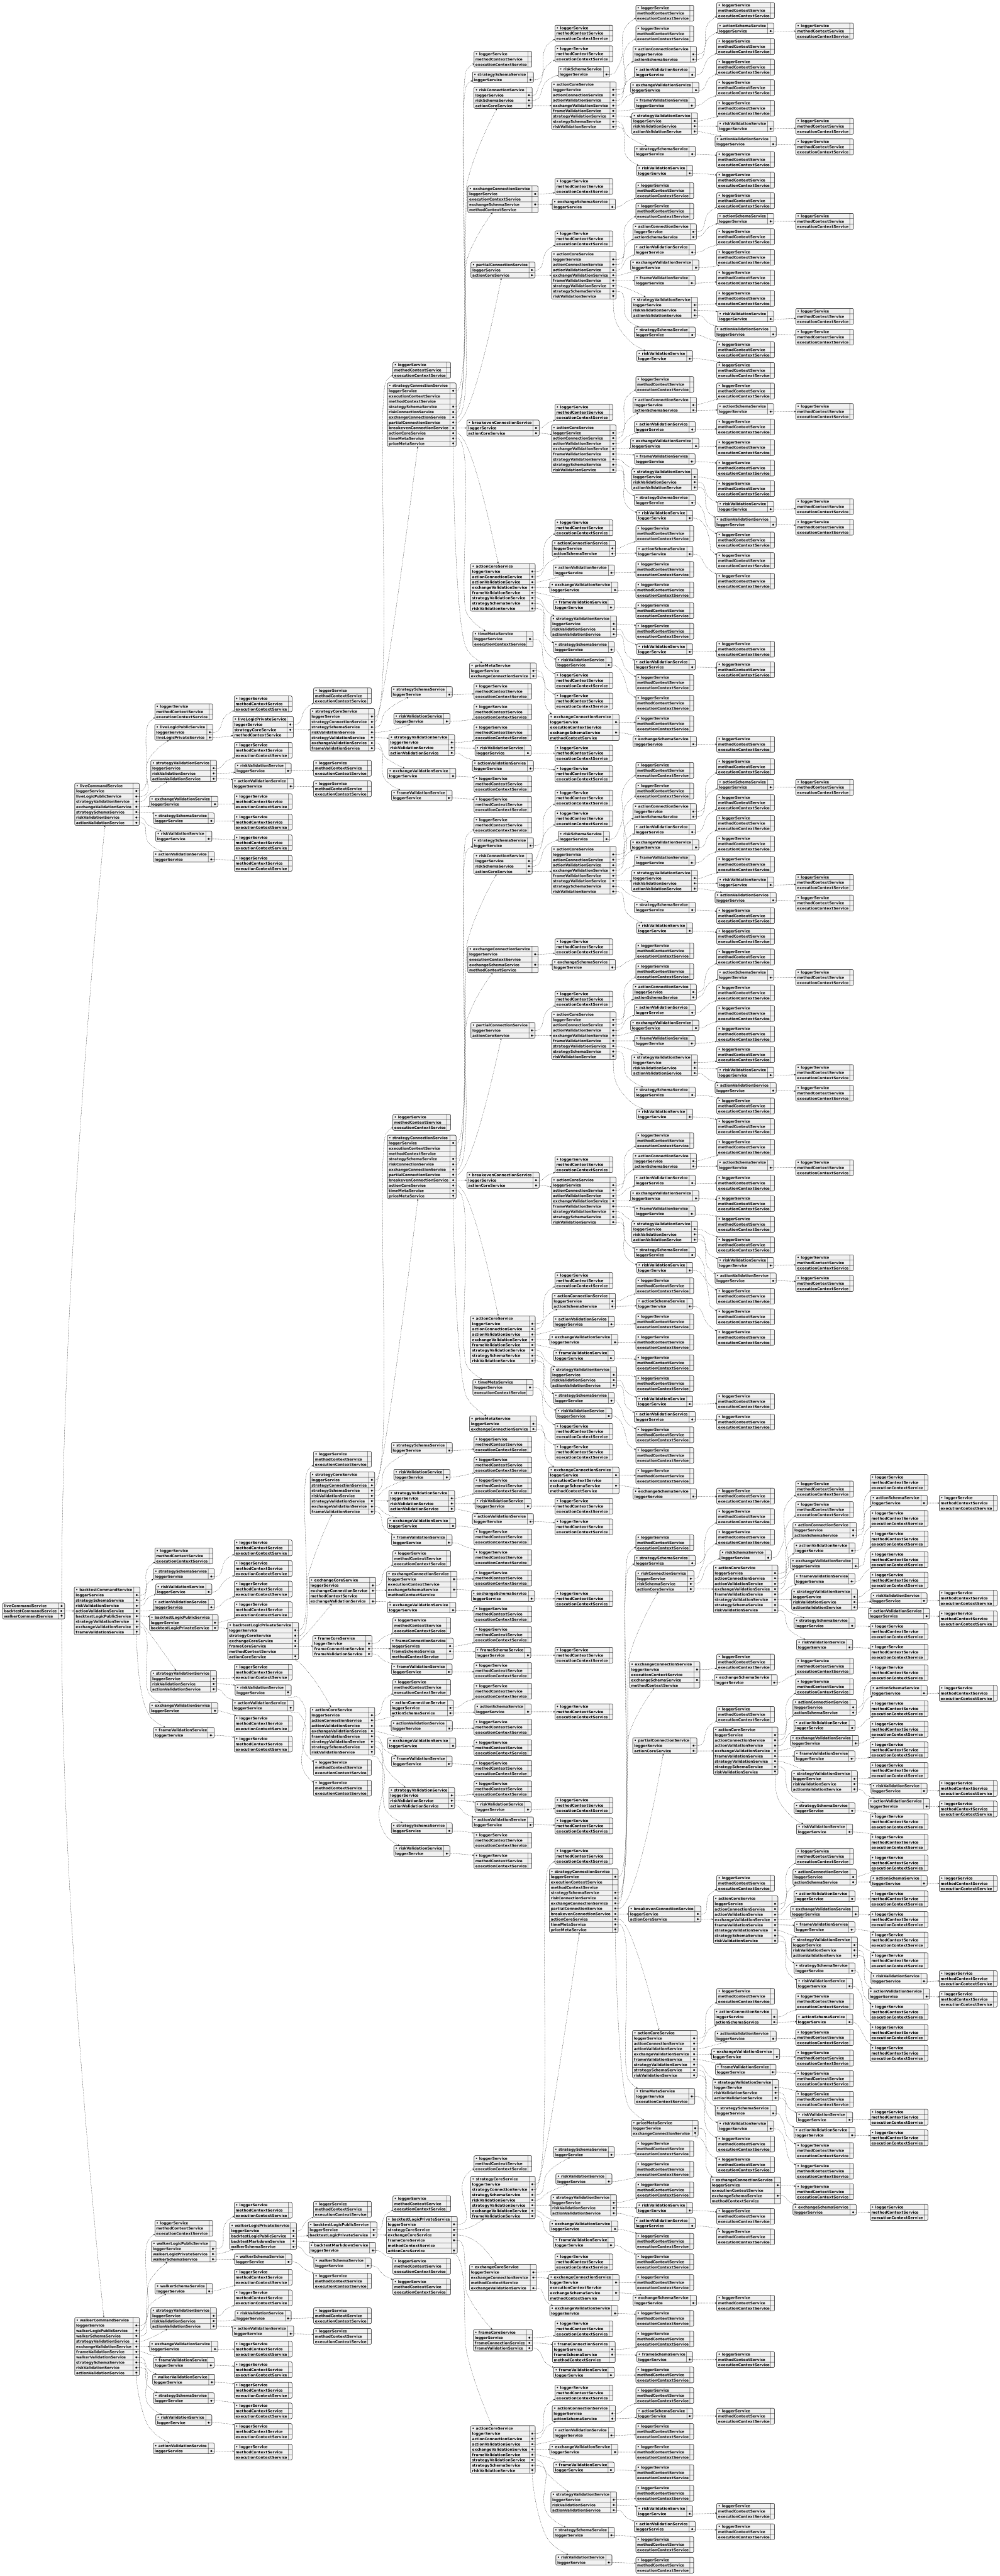
Overview:
Backtest-kit is a production-ready TypeScript framework for backtesting and live trading strategies with crash-safe state persistence, signal validation, and memory-optimized architecture. The framework follows clean architecture principles with dependency injection, separation of concerns, and type-safe discriminated unions.
Core Concepts:
- Signal Lifecycle: Type-safe state machine (idle → opened → active → closed) with discriminated unions
- Execution Modes: Backtest mode (historical data) and Live mode (real-time with crash recovery)
- VWAP Pricing: Volume Weighted Average Price from last 5 1-minute candles for all entry/exit decisions
- Signal Validation: Comprehensive validation ensures TP/SL logic, positive prices, and valid timestamps
- Interval Throttling: Prevents signal spam with configurable intervals (1m, 3m, 5m, 15m, 30m, 1h)
- Crash-Safe Persistence: Atomic file writes with automatic state recovery for live trading
- Async Generators: Memory-efficient streaming for backtest and live execution
- Accurate PNL: Calculation with fees (0.1%) and slippage (0.1%) for realistic simulations
- Event System: Signal emitters for backtest/live/global signals, errors, and completion events
- Graceful Shutdown: Live.background() waits for open positions to close before stopping
- Pluggable Persistence: Custom adapters for Redis, MongoDB, or any storage backend
Architecture Layers:
- Client Layer: Pure business logic without DI (ClientStrategy, ClientExchange, ClientFrame) using prototype methods for memory efficiency
- Service Layer: DI-based services organized by responsibility:
- Schema Services: Registry pattern for configuration with shallow validation (StrategySchemaService, ExchangeSchemaService, FrameSchemaService)
- Validation Services: Runtime existence validation with memoization (StrategyValidationService, ExchangeValidationService, FrameValidationService)
- Connection Services: Memoized client instance creators (StrategyConnectionService, ExchangeConnectionService, FrameConnectionService)
- Global Services: Context wrappers for public API (StrategyGlobalService, ExchangeGlobalService, FrameGlobalService)
- Logic Services: Async generator orchestration (BacktestLogicPrivateService, LiveLogicPrivateService)
- Markdown Services: Auto-generated reports with tick-based event log (BacktestMarkdownService, LiveMarkdownService)
- Persistence Layer: Crash-safe atomic file writes with PersistSignalAdaper, extensible via PersistBase
- Event Layer: Subject-based emitters (signalEmitter, errorEmitter, doneEmitter) with queued async processing
Key Design Patterns:
- Discriminated Unions: Type-safe state machines without optional fields
- Async Generators: Stream results without memory accumulation, enable early termination
- Dependency Injection: Custom DI container with Symbol-based tokens
- Memoization: Client instances cached by schema name using functools-kit
- Context Propagation: Nested contexts using di-scoped (ExecutionContext + MethodContext)
- Registry Pattern: Schema services use ToolRegistry for configuration management
- Singleshot Initialization: One-time operations with cached promise results
- Persist-and-Restart: Stateless process design with disk-based state recovery
- Pluggable Adapters: PersistBase as base class for custom storage backends
- Queued Processing: Sequential event handling with functools-kit queued wrapper
Data Flow (Backtest):
- User calls Backtest.background(symbol, context) or Backtest.run(symbol, context)
- Validation services check strategyName, exchangeName, frameName existence
- BacktestLogicPrivateService.run(symbol) creates async generator with yield
- MethodContextService.runInContext sets strategyName, exchangeName, frameName
- Loop through timeframes, call StrategyGlobalService.tick()
- ExecutionContextService.runInContext sets symbol, when, backtest=true
- ClientStrategy.tick() checks VWAP against TP/SL conditions
- If opened: fetch candles and call ClientStrategy.backtest(candles)
- Yield closed result and skip timeframes until closeTimestamp
- Emit signals via signalEmitter, signalBacktestEmitter
- On completion emit doneEmitter with { backtest: true, symbol, strategyName, exchangeName }
Data Flow (Live):
- User calls Live.background(symbol, context) or Live.run(symbol, context)
- Validation services check strategyName, exchangeName existence
- LiveLogicPrivateService.run(symbol) creates infinite async generator with while(true)
- MethodContextService.runInContext sets schema names
- Loop: create when = new Date(), call StrategyGlobalService.tick()
- ClientStrategy.waitForInit() loads persisted signal state from PersistSignalAdaper
- ClientStrategy.tick() with interval throttling and validation
- setPendingSignal() persists state via PersistSignalAdaper.writeSignalData()
- Yield opened and closed results, sleep(TICK_TTL) between ticks
- Emit signals via signalEmitter, signalLiveEmitter
- On stop() call: wait for lastValue?.action === 'closed' before breaking loop (graceful shutdown)
- On completion emit doneEmitter with { backtest: false, symbol, strategyName, exchangeName }
Event System:
- Signal Events: listenSignal, listenSignalBacktest, listenSignalLive for tick results (idle/opened/active/closed)
- Error Events: listenError for background execution errors (Live.background, Backtest.background)
- Completion Events: listenDone, listenDoneOnce for background execution completion with DoneContract
- Queued Processing: All listeners use queued wrapper from functools-kit for sequential async execution
- Filter Predicates: Once listeners (listenSignalOnce, listenDoneOnce) accept filter function for conditional triggering
Performance Optimizations:
- Memoization of client instances by schema name
- Prototype methods (not arrow functions) for memory efficiency
- Fast backtest method skips individual ticks
- Timeframe skipping after signal closes
- VWAP caching per tick/candle
- Async generators stream without array accumulation
- Interval throttling prevents excessive signal generation
- Singleshot initialization runs exactly once per instance
- LiveMarkdownService bounded queue (MAX_EVENTS = 25) prevents memory leaks
- Smart idle event replacement (only replaces if no open/active signals after last idle)
Use Cases:
- Algorithmic trading with backtest validation and live deployment
- Strategy research and hypothesis testing on historical data
- Signal generation with ML models or technical indicators
- Portfolio management tracking multiple strategies across symbols
- Educational projects for learning trading system architecture
- Event-driven trading bots with real-time notifications (Telegram, Discord, email)
- Multi-exchange trading with pluggable exchange adapters
Test Coverage:
The framework includes comprehensive unit tests using worker-testbed (tape-based testing):
- exchange.test.mjs: Tests exchange helper functions (getCandles, getAveragePrice, getDate, getMode, formatPrice, formatQuantity) with mock candle data and VWAP calculations
- event.test.mjs: Tests Live.background() execution and event listener system (listenSignalLive, listenSignalLiveOnce, listenDone, listenDoneOnce) for async coordination
- validation.test.mjs: Tests signal validation logic (valid long/short positions, invalid TP/SL relationships, negative price detection, timestamp validation) using listenError for error handling
- pnl.test.mjs: Tests PNL calculation accuracy with realistic fees (0.1%) and slippage (0.1%) simulation
- backtest.test.mjs: Tests Backtest.run() and Backtest.background() with signal lifecycle verification (idle → opened → active → closed), listenDone events, early termination, and all close reasons (take_profit, stop_loss, time_expired)
- callbacks.test.mjs: Tests strategy lifecycle callbacks (onOpen, onClose, onTimeframe) with correct parameter passing, backtest flag verification, and signal object integrity
- report.test.mjs: Tests markdown report generation (Backtest.getReport, Live.getReport) with statistics validation (win rate, average PNL, total PNL, closed signals count) and table formatting
All tests follow consistent patterns:
- Unique exchange/strategy/frame names per test to prevent cross-contamination
- Mock candle generator (getMockCandles.mjs) with forward timestamp progression
- createAwaiter from functools-kit for async coordination
- Background execution with Backtest.background() and event-driven completion detection
backtest-kit interfaces
Interface WalkerStopContract
This interface defines the information shared when a trading walker needs to be stopped, typically during backtesting or in a controlled interruption.
It allows you to pinpoint exactly which walker and strategy should halt execution. This is particularly useful when multiple walkers are running on the same trading symbol.
The symbol indicates the trading pair involved, while strategyName identifies the specific trading strategy to stop. The walkerName provides an extra layer of identification to distinguish between walkers if multiple are active.
Importantly, these stop signals are exclusively for backtesting environments; the backtest property always confirms this. The when property provides a virtual timestamp related to the strategy's execution, not real-world time.
Interface WalkerStatisticsModel
This model represents the combined results of running multiple trading strategies, designed to make analyzing and comparing them easier. It builds upon the basic WalkerResults, adding details about how each strategy performed relative to others. The key piece of information is strategyResults, which is a list of all the results collected from each individual strategy that was backtested. You can use this to see which strategies did best and understand how they compare.
Interface WalkerContract
The WalkerContract acts as a messenger, sharing updates on the progress of comparing different trading strategies. It's triggered whenever a strategy finishes its backtest and its performance is assessed.
Each update contains key details like the name of the strategy tested, the exchange and frame it's running on, the trading symbol being evaluated, and vital performance statistics.
You'll also find information about the metric being optimized – like Sharpe Ratio – its current value for the completed strategy, and the best value seen so far across all strategies. It keeps track of how many strategies have been tested and how many are left to go.
A key element is the when property, which provides the precise simulated time of the backtest – it's not real-world time, but the timestamp of the last candle processed. Knowing the stage of backtest and the date/time is useful in understanding what is going on with the optimization process.
Interface WalkerCompleteContract
The WalkerCompleteContract represents the final notification that a backtesting process has finished successfully. It holds all the key information about the completed run, including the name of the walker that performed the tests, the symbol being analyzed, and the exchange and timeframe used.
You’ll find details about the optimization metric employed, the total number of strategies evaluated, and, most importantly, the name and performance metrics of the top-performing strategy.
The contract also provides comprehensive statistics for that best strategy.
Finally, it indicates that this is solely a backtest event and provides the precise time the backtest concluded, based on the latest candle timestamp across all strategies. This time isn't a real-world clock time, but rather a calculated value representing the end of the test period.
Interface ValidationErrorNotification
This notification signals that a validation error occurred during your trading strategy's assessment. It’s designed to help you understand and fix issues related to risk validation functions.
Each notification carries a unique identifier (id) and a detailed error object (error) containing information like a stack trace and extra data. A user-friendly explanation of the error (message) is also included to make debugging easier. Importantly, this notification always indicates that the error arose from a validation process, not an actual live trading scenario (backtest: false).
Interface ValidateArgs
This interface, ValidateArgs, provides a standardized way to ensure the correctness of names used throughout the backtest-kit trading framework. It’s essentially a container for validating different components like exchanges, timeframes, strategies, and risk profiles.
Think of it as a central place to make sure you're using the right labels for everything in your trading setup.
Each property within ValidateArgs (like ExchangeName, FrameName, StrategyName, etc.) holds an enum. This enum acts as a whitelist, guaranteeing that the name you're using for a specific element belongs to a recognized and registered option. This contributes to a more robust and error-free backtesting process. It simplifies validation across various components by using the same argument structure.
Interface TrailingTakeCommitNotification
This notification lets you know when a trailing take-profit order has been executed, providing a detailed snapshot of the trade. It's essentially a confirmation that your trailing stop has triggered and a trade has been closed.
You'll find key information like the trade's unique ID, the timestamp of the execution, and whether it occurred in backtest or live mode. It includes details about the trading pair, the strategy that generated the signal, and the exchange used.
The notification breaks down the specifics of the trade, including the original and adjusted take-profit and stop-loss prices, entry price, and the percentage shift applied to the take-profit. You’ll also get comprehensive performance data like total profit/loss, peak profit, maximum drawdown, and various pricing details.
Furthermore, it provides details about the trade's cost, leverage used, and how many entries or partial closes were involved. A helpful "note" field can contain a human-readable explanation for the trade, if provided. Finally, timestamps are included for when the signal was created, became pending, and when this specific notification was generated.
Interface TrailingTakeCommit
This object represents an event triggered when a trailing take profit order is executed. It provides detailed information about the trade and the trailing adjustment that occurred.
The action field simply confirms this is a trailing take event.
You'll find the percentShift here, which tells you how much the take profit level was adjusted based on the trailing rule. The currentPrice shows the market price when the trailing took place.
Important performance metrics of the position are included as well: total Profit and Loss (pnl), the highest profit reached (peakProfit), and the largest drawdown experienced (maxDrawdown).
The position field clarifies whether the trade is a long (buy) or short (sell) position.
It also contains the initial entry price (priceOpen), the adjusted take profit price (priceTakeProfit), and the adjusted stop loss price (priceStopLoss). You can refer to originalPriceTakeProfit and originalPriceStopLoss to see the initial, unaltered price levels.
Finally, the scheduledAt and pendingAt timestamps provide when the signal was created and when the position was activated, respectively.
Interface TrailingStopCommitNotification
This notification tells you when a trailing stop order has been triggered and executed. It's a detailed record of what happened when your trailing stop adjusted the stop-loss price and ultimately resulted in a trade.
The type confirms this is a trailing stop commit notification. A unique id identifies this specific event.
The timestamp tells you exactly when the trade occurred. backtest indicates whether this happened during a simulated test or in a real live trading environment. You’ll also find details like the trading pair (symbol), the strategy that generated the signal (strategyName), and the exchange used (exchangeName).
It also includes technical details like the original signal’s signalId, the percentage shift applied to the stop-loss (percentShift), and the current market price (currentPrice) at the time of the execution.
The notification also provides details about the trade itself, including position (long or short), entry price (priceOpen), take profit and stop-loss prices (priceTakeProfit, priceStopLoss), and cost.
You’ll get a full picture of the position’s performance with data on total profit/loss (pnl), peak profit, maximum drawdown, and various price points along the way. It also includes information about DCA entries, partial closes, slippage, and fees. Finally, there's an optional note field for extra context. You’ll find scheduling and creation timestamps (scheduledAt, pendingAt, createdAt) to trace the order’s full lifecycle.
Interface TrailingStopCommit
This interface describes an event triggered when a trailing stop loss mechanism activates. It provides detailed information about the trade's current state and performance.
The action property confirms that this event relates to a trailing stop adjustment. You'll find the percentage shift used to modify the stop loss in percentShift.
The currentPrice indicates the market price at the time the trailing stop was triggered. Crucially, it also includes performance data: pnl shows the total profit/loss of the closed position, peakProfit represents the highest profit achieved, and maxDrawdown signifies the largest loss experienced.
The position property specifies whether the trade is a long (buy) or short (sell) position. Important pricing information like the original entry price (priceOpen), take profit price (priceTakeProfit), and stop loss price (priceStopLoss) are included, alongside their original, pre-trailing-adjustment values.
Finally, scheduledAt records the timestamp when the signal was generated, while pendingAt marks when the position was initially activated.
Interface TickEvent
This describes a standardized way to represent events related to trades, ensuring all the necessary information is available regardless of the specific action taken. The TickEvent object bundles together details like timestamps, action types (like scheduled, opened, closed, etc.), and crucial price points such as open price, take profit, and stop loss. It also includes information about averaging strategies (total entries), partial closes, and performance metrics like P&L cost, percentage progress towards targets, and peak/fall P&L. Different properties are applicable depending on the event type, ensuring clarity and consistency in reporting and analysis.
Interface SyncStatisticsModel
This model holds information about how signals are synchronized within the backtest. Think of it as a report card for the syncing process.
It keeps track of every synchronization event, giving you a detailed list of what happened. You'll also find the total number of sync events, and separate counts for signals that were opened and signals that were closed. This helps you understand the flow and lifecycle of your signals during the backtest.
Interface SyncEvent
This data structure, called SyncEvent, acts as a comprehensive record of everything that happens to a trading signal throughout its lifecycle. Think of it as a detailed log entry for each significant event, designed to be easily understandable when creating reports.
It bundles together information such as the exact time the event occurred, the trading pair involved, the strategy and exchange names, and whether it’s related to a backtest.
You’ll find details about the signal itself, like its unique ID and the action taken (like opening or closing a position). Importantly, it tracks pricing information like the entry price, take profit, and stop-loss levels, as well as how those levels might have changed over time.
For positions, it includes details about the number of entries or partial closes, the profit and loss (pnl), and the peak profit and maximum drawdown seen. Finally, it specifies the reason for closing the signal (if applicable) and when the signal was initially created and became active.
Interface StrategyStatisticsModel
This model holds all the key statistics gathered during a backtest related to a trading strategy's actions. It's essentially a record of what your strategy did and how often.
You'll find a detailed list of individual strategy events, called eventList, along with the total number of events that occurred (totalEvents).
The model also breaks down event counts by type, such as the number of times a strategy canceled a scheduled action (cancelScheduledCount), closed a pending order (closePendingCount), took partial profits or losses (partialProfitCount, partialLossCount), adjusted a trailing stop or take profit (trailingStopCount, trailingTakeCount), and set breakeven prices (breakevenCount).
Finally, it tracks the occurrence of scheduled activations (activateScheduledCount) and average buy (dollar-cost averaging or DCA) actions (averageBuyCount).
Interface StrategyPauseNotification
This notification lets you know when a trading strategy's pause state has changed. It's triggered whenever the strategy is actively paused or resumed. When paused, the strategy stops opening new trades, but any existing trades still get managed and closed as usual.
The notification includes details like the strategy's name, the trading pair involved, the exchange being used, and whether the event happened during a backtest or live trading. It also tells you the new pause state – whether the strategy is now paused or resumed. You'll find a timestamp indicating exactly when the pause state changed, along with the creation timestamp of the notification itself. The notification ID is provided for referencing this specific event.
Interface StrategyEvent
This StrategyEvent provides a comprehensive record of what's happening during your trading strategy's execution, whether it's a backtest or a live trade. It bundles all the relevant details about strategy actions into one place, making it easier to understand and analyze performance. You'll find information like the exact timestamp of the event, the trading pair involved, the strategy's name, and the exchange being used.
It also captures key technical details like the signal ID, the type of action taken (like buying, selling, or adjusting stops), and the current market price. For more complex strategies, you'll see data related to partial profit taking, trailing stops, and the IDs associated with scheduled or pending actions.
Furthermore, it includes details about the position itself – whether it’s a long or short trade – as well as the entry price and stop-loss/take-profit levels, both as they were initially set and after any trailing adjustments. For strategies using dollar-cost averaging (DCA), you’ll also find the averaged entry price and the number of entries or partial closes. Finally, it includes performance metrics like the profit and loss (PNL) and, for DCA strategies, the cost of the entry. A note field allows you to add custom descriptions to actions.
Interface SignalScheduledNotification
This notification type signals that a trading signal has been planned for future execution. It provides comprehensive details about the upcoming trade, acting like a blueprint for what's about to happen.
You'll find information like the signal's unique ID, when it's scheduled to execute (both in milliseconds and a readable timestamp), and whether it’s part of a backtest or a live trade. The notification also includes specifics on the trading pair, the strategy generating the signal, the exchange where the trade will occur, and the planned trade direction (long or short).
It goes into great detail regarding the trade's price targets, stop-loss levels, and even the original planned prices before any adjustments like DCA or trailing stops. You’ll also see information about the total number of entries and partial closures related to the signal, as well as the cost of the initial position.
Crucially, it includes detailed performance metrics like projected profit/loss (both as percentages and dollar amounts), peak profit levels, and maximum drawdown information. There’s also a field for an optional note which allows for explanations regarding the reason for the signal. Finally, the notification includes information related to the signal creation time.
Interface SignalOpenedNotification
This notification tells you when a new trade has been opened. It provides a wealth of information about the trade, including when it started, whether it’s a backtest or live trade, and the specifics of the position like its direction (long or short) and entry price. You'll find details like the take profit and stop loss levels, as well as how many entries and partial closes were involved, and the total cost of the trade.
The notification also includes performance metrics like peak profit, maximum drawdown, and profit/loss percentages. You can see how the trade has performed so far, including the prices and costs associated with those milestones. Finally, it offers optional notes to give context about why the signal was triggered. Timestamps for creation, pending, and execution are also present.
Interface SignalInfoNotification
This notification provides detailed information about a trading signal that a strategy generated for an open position. It's essentially a way for strategies to communicate extra details about their actions, beyond just the basic order placement.
The type clearly identifies it as a "signal.info" notification, meaning it's not a critical event like a trade execution, but rather a descriptive note. Each notification has a unique id and timestamp, and indicates whether it originated from backtesting (backtest: true) or live trading (backtest: false). You'll also find details like the trading symbol, the strategyName that generated it, the exchangeName, and a unique signalId.
It includes key price points like currentPrice, priceOpen, priceTakeProfit, and priceStopLoss, along with their original values before any trailing stop adjustments. The notification also breaks down the trade’s financial aspects: cost (initial investment), multiplier (leverage applied), and totalEntries and totalPartials (how many DCA entries and partial exits were involved).
You get a comprehensive view of the position’s performance with metrics like pnl, peakProfit, and maxDrawdown, all detailed with corresponding priceOpen, priceClose, and cost values. The pnlPercentage provides the profit or loss as a percentage.
Finally, the note field allows the strategy to include its own custom message to explain the reasoning behind the trade or signal. The notificationId allows you to link this to an external tracking system. Timestamps for creation, scheduling and pending are also present.
Interface SignalInfoContract
This defines the structure for informational messages that strategies can send during trading. Think of it as a way for strategies to broadcast custom notes or debugging information about their actions. These messages are triggered when a strategy uses the commitSignalInfo() function.
The message includes important details like the trading symbol (e.g., BTCUSDT), the name of the strategy generating it, and the exchange and frame it's operating within. It also carries the complete signal data, the current market price, and any custom note or identifier the strategy wants to include.
Crucially, the message indicates whether it's coming from a backtest (historical data) or live trading, and provides a timestamp and date/time for when the event occurred, noting that backtest times represent the candle’s timestamp, not wall-clock time. You can subscribe to these notifications to receive these custom messages from your strategies.
Interface SignalEventContract
This interface, SignalEventContract, provides a way to track when trading positions are opened or closed during backtesting or live trading, without needing to monitor the entire signal stream. It's like getting notifications about the key moments – when a trade starts or ends.
The action property tells you whether a position was opened or closed. You'll receive events for every possible scenario, covering different entry and exit methods – whether it's a new signal, a scheduled activation, or a manual user action, and whether the exit is due to a take-profit, stop-loss, time expiration, or other reason.
The event contains a lot of information, including the trading symbol, the strategy involved, the exchange, the timeframe, and all the details of the signal itself (price levels, P&L, etc.). If a position is closed, the closeReason property tells you why it was closed.
You’ll also find the current market price at the time of the event and flags indicating if it’s a backtest or live event, along with precise timestamps and date/time information allowing synchronization with other data sources. It’s all about keeping track of what's happening with your signals in a streamlined way.
Interface SignalData$1
This interface, SignalData, describes the information you get for each closed trade when analyzing backtest results. Think of it as a snapshot of a completed trade.
It includes key details like the strategy that created the signal, a unique identifier for that signal, the symbol being traded (like BTC/USD), whether you were long or short, the percentage profit or loss on the trade, and why the trade was closed. Finally, it also records the exact times when the trade was opened and closed, allowing for precise analysis of performance over time.
Interface SignalCommitBase
This defines the core information shared by all signal commit events within the backtest-kit framework. Think of it as the basic building block for understanding what happened during a trade.
Each event includes details like the trading pair involved (symbol), the name of the strategy that generated the signal, and the exchange it was executed on. It also tells you if the event happened during a backtest or in live trading.
You'll find a unique ID for each signal, the exact time of the event, and how many entries and partial closes were involved. It also remembers the original entry price, and provides the actual signal data itself. A helpful note field allows you to add custom explanations for why a signal was triggered.
Interface SignalClosedNotification
This notification tells you when a trading position has been closed, whether it was a take profit, stop loss, or some other reason. It provides a wealth of detail about the trade, including the unique identifiers for the signal and position, the exchange and strategy involved, and whether it happened in backtest or live mode.
You’ll find information about the entry and exit prices, the original target and stop-loss levels, and details on any DCA (Dollar-Cost Averaging) strategies used. The notification also includes a breakdown of the position's profitability, including peak profit, maximum drawdown, and associated prices and costs.
It also shows how long the position was open, and a human-readable note if one exists. Finally, you can view the timing of when the signal was scheduled, became pending, and ultimately created.
Interface SignalCancelledNotification
This notification signals that a trading signal, which was previously scheduled, has been cancelled before it could be activated. It provides a detailed snapshot of the signal's planned parameters and context at the time of cancellation. You'll find information like the signal's ID, the trading pair involved (e.g., BTCUSDT), the strategy that generated it, and details about the planned trade – including entry and exit prices, and leverage settings. The notification also includes specifics about why the signal was cancelled, whether it was part of a backtest or live trading, and important metrics like potential profit and loss calculations, all set to zero since the trade never actually occurred. This allows you to understand why a signal didn't execute and to analyze potential issues within your trading strategy or scheduling process.
Interface Signal
The Signal object holds vital information about a trading signal. It tracks the initial entry price of a position with the priceOpen property.
It also keeps a record of all entry events using the _entry array, storing details like the entry price, associated costs, and the time of entry.
Finally, _partial is an array that records any partial exits taken on the position, noting the type (profit or loss), percentage, price at the time, the cost basis at closing, the number of shares or contracts at closing, and the timestamp.
Interface Signal$3
This section describes the Signal$3 object, which represents a trading signal within the backtest-kit framework. It holds key information about a position.
The priceOpen property tells you the initial price at which the position was started.
The _entry property is an array detailing each entry point into the position, including the price, total cost, and timestamp of each entry.
The _partial property is an array tracking any partial exits from the position, such as taking profits or cutting losses, along with details like the percentage of the position closed, the price at the time of the exit, and the cost basis at the time of the closure.
Interface Signal$2
This Signal object represents a single trading signal within the backtest-kit framework. It holds vital information about a trade, primarily the entry price, which is stored in the priceOpen property.
It also keeps a record of the initial entry details, including the price, cost, and the exact time the trade began, accessible via the _entry array.
Furthermore, the _partial array tracks any partial exits or adjustments made to the position, noting the type of adjustment (profit or loss), percentage, current price, cost basis, entry count, and timestamp. These properties collectively allow for a detailed reconstruction and analysis of a trade’s lifecycle.
Interface Signal$1
This Signal object keeps track of key information related to a single trading position.
It has a priceOpen property, which simply stores the price at which the position was initially entered.
The _entry array holds a record of each entry made within the position, detailing the price, cost, and timestamp of each entry.
Finally, _partial is an array documenting any partial exits from the position, noting whether they were profit-taking or loss-limiting actions, the percentage of the position exited, the price at the time, the cost basis when the partial exit occurred, the number of units held at that time, and the associated timestamp.
Interface ScheduledEvent
This data structure brings together all the key information about trading events – when they were scheduled, opened, or cancelled – making it easier to generate reports and analyze performance. Each event is identified by a timestamp and categorized by its action: whether it was scheduled, cancelled, or opened.
You'll find details about the specific trade, including the symbol being traded, a unique signal ID, and the position type. There's also a note providing extra context about the signal.
Crucially, the data includes pricing information – the current price at the time of the event, the planned entry price, and take profit/stop loss levels, along with their original values before any modifications. For strategies utilizing DCA, details like the total entries, partial closes, and the original open price are included.
For cancelled events, a cancellation reason and a unique ID are provided. For opened events, you’ll find the timestamp indicating when the position became active. Finally, it includes unrealized profit and loss (PNL) and, if applicable, how long the position lasted.
Interface ScheduleStatisticsModel
This model provides a way to understand how your scheduled signals are performing. It gathers data about the signals you’ve scheduled, those that have been activated, and those that were cancelled.
You’ll find a detailed list of all events, including when they were scheduled, opened, or cancelled.
The model also summarizes the total number of events, scheduled signals, opened signals, and cancelled signals, giving you an overview of the activity.
Key performance indicators like the cancellation rate (how often signals are cancelled), the activation rate (how often signals become active), and average waiting times for both cancelled and opened signals are included. These metrics help you evaluate and refine your scheduling strategies.
Interface SchedulePingContract
The SchedulePingContract provides a way to keep track of what's happening with your active scheduled trading signals. Think of it as a heartbeat signal emitted every minute while a signal is running – it's not emitted when the signal is starting or stopping.
This ping event includes key details about the signal, like the trading pair (symbol), the strategy using it, and the exchange it's on. You'll also see information about the timeframe (frameName) and all the signal's data, like entry price, take profit, and stop loss levels.
The current price at the time of the ping, and whether the signal is running in backtest or live mode, are also included. This allows you to build custom logic, such as automatically canceling a signal if the price moves beyond certain boundaries. Finally, a timestamp tells you precisely when the ping occurred – either the real-time clock during live trading, or the time of the historical candle during backtesting. You can listen for these events to monitor your signals and potentially implement custom actions.
Interface ScheduleEventContract
This interface helps you keep track of what's happening with your scheduled trading signals – when they're first created and when they're cancelled. Think of it as a notification system for signals that haven't yet turned into actual trades. You can use it to monitor the lifecycle of these signals without needing to constantly monitor all the signal data.
It doesn't tell you when a scheduled signal actually becomes a trade, just the events leading up to it.
Here’s what information you get with each notification:
- Action: Whether a new signal was scheduled or an existing one was cancelled.
- Symbol: The trading pair involved (like BTCUSDT).
- Strategy Name: The name of the strategy that created the signal.
- Exchange Name: Where the signal originates.
- Frame Name: The timeframe or date range associated with the signal.
- Data: All the details of the signal itself (price targets, position size, etc.).
- Reason (for cancellations only): Why the signal was cancelled – was it a timeout, a rejected price, or a user action?
- Current Price: The price of the asset at the moment of the event.
- Backtest: Indicates whether this event is from a historical backtest or live trading.
- Timestamp & When: Provides the exact time the event occurred, which might be a virtual time in backtesting.
You listen for these events using listenOrderSchedule().
Interface RiskStatisticsModel
This model holds information about risk rejections, helping you understand where and why your system is rejecting trades.
It contains a complete list of the risk rejection events, allowing you to dig into the specifics of each one. You'll also find the total number of rejections, a breakdown of rejections by the trading symbol, and a breakdown by the strategy used. This allows you to quickly identify patterns and areas for improvement in your risk management.
Interface RiskRejectionNotification
This notification lets you know when a trading signal was blocked by your risk management rules. It happens when the system decides a trade isn't safe to execute, either during a backtest or in live trading. The notification includes details like the strategy that tried to place the trade, the symbol involved (like BTCUSDT), and a clear explanation of why the signal was rejected.
You’ll find useful information for debugging, such as the unique identifier of the rejected signal, the current market price at the time, and even details about any existing positions you held. It also provides information regarding the trade itself like its take profit, stop loss, and trade direction.
The notification also includes technical details like timestamps, identifiers, and a multiplier setting to show how leverage impacts the trade. Finally, it specifies when the notification was created in the system.
Interface RiskEvent
The RiskEvent data structure holds information about situations where trading signals were blocked due to risk management rules. It essentially logs when a potential trade was rejected and why.
Each event includes details like the exact time of the rejection, the trading pair involved, the specifics of the rejected signal, and the strategy and exchange responsible. You'll also find the current market price at the time, how many positions were already open, and a unique identifier for the rejection, as well as the reason for the rejection.
Finally, a flag indicates whether the event occurred during a backtest simulation or a live trading scenario.
Interface RiskContract
The RiskContract represents a rejected trading signal due to risk validation. It's emitted when a strategy's signal is blocked because it violates pre-defined risk limits.
Think of it as a notification that something went wrong – a strategy tried to make a trade, but the system prevented it due to a risk rule.
This contract provides details about the rejected signal, including the trading pair (symbol), the signal’s specifics (like entry price and stop-loss), the strategy that initiated it, and the timeframe it was intended for.
You’ll find information like the current market price, the number of active positions, and a unique ID for tracking. There’s also a human-readable explanation of why the signal was rejected, making it easier to understand the issue.
Timestamp data indicates precisely when the rejection occurred, and a flag distinguishes between backtesting and live trading scenarios. These details are crucial for monitoring risk events, identifying patterns, and improving risk management strategies.
Interface ProgressWalkerContract
The ProgressWalkerContract defines how a background process, like a backtest or strategy evaluation, reports its progress.
It's designed to give you updates while a lengthy task is running, telling you things like the name of the process, which exchange and frame it’s using, and the symbol being analyzed.
You'll see information on how many strategies are involved, how many have been completed, and the overall percentage of completion.
Crucially, progress events are specifically for backtesting scenarios and always indicate that.
Finally, the 'when' property provides a timestamp representing the end of the most recent completed strategy – this isn’t real-time, but related to the timeframe of the analysis.
Interface ProgressBacktestContract
This interface helps you keep track of how a backtest is going. It provides updates as the backtest runs, letting you know how much data has been processed and how close it is to finishing.
Each update includes the exchange and strategy being used, the symbol being traded, and the total number of data points the backtest will analyze. You'll also get a percentage indicating the completion status, ranging from 0% to 100%.
Importantly, the when property indicates the virtual time of the backtest at the moment the progress was recorded; it’s not real-world time. Finally, backtest is always true, signifying that this progress event relates specifically to backtesting and not live trading.
Interface PerformanceStatisticsModel
This model holds performance data collected during backtesting, broken down by the strategy used. It tells you the name of the strategy that ran, the total number of events tracked, and the overall time it took to complete all performance checks.
You’ll also find a collection of statistics grouped by the type of metric being measured. Finally, it contains a list of all the individual performance events, giving you the raw details behind the summarized numbers. This provides a comprehensive view of how your trading strategy performed.
Interface PerformanceContract
The PerformanceContract helps you understand how quickly different parts of your trading system are running. It's like a detailed report card for your backtest or live trading.
Each entry, or event, records when something happened and how long it took.
Here's what you'll find in each report card entry:
- timestamp: When the event occurred, precisely measured in milliseconds.
- when: The relevant trading time - either the time period being analyzed in backtest mode, or the time of the tick in live mode.
- previousTimestamp: Lets you see the timing between events.
- metricType: What kind of operation was being performed (like calculating an indicator or placing an order).
- duration: How long that operation took to complete, again in milliseconds.
- strategyName: Which trading strategy was involved.
- exchangeName: Which exchange was being used.
- frameName: Which timeframe was being used for the analysis (only present in backtest mode).
- symbol: The trading symbol (e.g., AAPL, BTCUSD).
- backtest: Indicates whether the data is from a backtest or live trading.
By analyzing these PerformanceContract events, you can pinpoint slow areas and optimize your code for better performance.
Interface PauseContract
This interface describes when a trading strategy is paused or resumed.
It's emitted by the backtest-kit framework when a strategy's pause status changes, for example, if you temporarily stop it from trading. When paused, the strategy won’t create new trading orders, but any existing orders will still be handled.
The information includes details like the trading symbol involved, whether the strategy is now paused or active, and the exact time of the change. You can use this information to inform users, perhaps through a notification service.
It also specifies whether the pause/resume event occurred during a backtest simulation or live trading, which is important for different types of handling. You’ll find the strategy's name, the exchange it's using, and the timeframe (like 1-minute or 5-minute intervals).
Interface PartialStatisticsModel
This model holds key statistics about partial profit and loss events during a trading backtest. It’s designed to help you understand how your strategy performs when it's taking partial positions.
The eventList gives you a complete record of each profit or loss event, including all the relevant details. You’ll also find the totalEvents representing the total number of events that occurred, along with totalProfit and totalLoss which show you the count of profitable and loss-making events respectively. These numbers let you quickly assess the overall balance of your strategy's partial position management.
Interface PartialProfitContract
The PartialProfitContract represents when a trading strategy hits a partial profit milestone, like 10%, 20%, or 30% profit. It's a way to keep track of how a strategy is performing and when it's taking partial profits.
These events are generated by the framework as a signal progresses and reaches these predefined profit levels. Each event provides details like the trading symbol, the strategy used, the exchange and frame where the trade is happening, and the original data associated with the signal.
You'll also find the current market price at the time of the milestone, the specific profit level achieved, whether it’s a backtest or live trade, and a timestamp indicating when it occurred. Think of it as a snapshot of progress during a trade, giving insights into the strategy's behavior. The data included is comprehensive, containing original signal prices and whether partial execution has occurred. This information is used by reporting services or custom logic to monitor performance and manage positions.
Interface PartialProfitCommitNotification
This notification details a partial profit-taking action that occurred within a trading strategy. It provides a wealth of information about the trade, including when it happened (timestamp), whether it was a backtest or live trade, and the specific symbol being traded. You'll find details about the strategy and exchange involved, along with a unique identifier for the signal that triggered the action.
The notification breaks down precisely how much of the position was closed (percentage), the current market price at the time, and the trade’s direction (long or short). It also includes details about the entry and take-profit prices, as well as the original, pre-adjustment prices.
Furthermore, the notification contains key financial metrics for the trade, such as the initial cost, leverage applied (multiplier), and metrics related to the position's performance like peak profit, maximum drawdown, and percentage profit/loss. It even includes the number of entries and partial closes made, alongside comprehensive Profit & Loss (PNL) information, including price points and cost calculations. Finally, optional notes and timing data (scheduled, pending, and creation timestamps) add extra context.
Interface PartialProfitCommit
This data represents a partial profit-taking event within a trading strategy. It details a situation where a portion of an existing position is being closed, not a complete exit. The action field confirms this is a partial profit event.
The percentToClose specifies what percentage of the original position size is being closed. You’ll also find key price information, including the current market price, the original entry price (priceOpen), and the final take profit and stop loss prices, both as they were initially set and adjusted.
Crucially, the information includes performance metrics for the position up to this point, like total profit and loss (pnl), the highest profit achieved (peakProfit), and the largest drawdown experienced (maxDrawdown). The direction of the trade (position) – whether it was a long or short – is also provided. Finally, timestamps indicate when the signal was created and when the position initially activated.
Interface PartialProfitAvailableNotification
This notification lets you know when a trading strategy has reached a profit milestone, like 10%, 20%, or 30% gain. It's a signal that things are going well with a trade!
The notification includes a lot of details about the trade, such as the trading pair (like BTCUSDT), the strategy used, and the exchange where the trade happened. You'll also see important data points like the entry price, the current market price, the take profit and stop loss levels (both original and adjusted for trailing), and the current position (long or short).
It also provides crucial performance metrics – total profit and loss, peak profit, and maximum drawdown – all calculated throughout the trade's lifespan. You'll find information related to the number of entries and partial closes, as well as timestamps for various stages of the trade, including when the signal was created, became pending, and when this partial profit level was reached. A note field can give you a human-readable explanation of the reason behind the signal.
Interface PartialLossContract
The PartialLossContract represents notifications about a trading strategy hitting predefined loss levels, like -10%, -20%, or -30% drawdown. These notifications are triggered when a signal encounters a loss level milestone.
Each notification contains detailed information, including the trading symbol, the name of the strategy that generated the signal, and the exchange and frame where the trade is taking place. You'll find the original signal data, the current market price at the time of the event, and the specific loss level reached.
It’s important to note that these events are only sent once for each signal and each loss level, even if prices move significantly. The backtest flag indicates whether the event originates from a historical backtest or from live trading. Finally, each notification includes precise timestamps to track exactly when the loss level was detected, either reflecting a historical candle or the wall-clock time during live trading.
Interface PartialLossCommitNotification
This notification signifies that a portion of a trading position has been closed. It provides detailed information about this partial closure, including a unique identifier, the exact time it occurred, and whether it happened during a backtest or live trading. You'll find specifics about the trading pair, the strategy and exchange involved, and the percentage of the position that was closed.
The notification also details the current market price, the trade direction (long or short), and the original entry price. It includes crucial pricing data like take profit and stop loss levels, both original and adjusted for any trailing.
Beyond the immediate trade details, you'll find a comprehensive view of the position's performance: peak profit, maximum drawdown, and profit/loss metrics, both in percentage and absolute USD values. Finally, it contains additional contextual information like the reason for the signal, its scheduling and creation times, and the number of entries and partials executed. This thorough report helps you understand the full context of the partial position closure and its impact on performance.
Interface PartialLossCommit
This describes an event indicating a partial closure of a trading position. It signifies a strategy is reducing its exposure rather than exiting the position entirely.
The action property clearly identifies this as a "partial-loss" event.
You'll find details about the percentage of the position being closed (percentToClose) and the current market price (currentPrice) at the time of this action.
The event also includes a comprehensive record of the position’s performance: the total profit and loss (pnl), the highest profit achieved (peakProfit), and the maximum drawdown experienced (maxDrawdown).
Crucially, you can see the direction of the trade (position), the original entry price (priceOpen), and the intended take profit and stop-loss prices (both original – priceTakeProfit, priceStopLoss – and those adjusted by trailing).
Finally, the scheduledAt and pendingAt timestamps provide precise timing information related to when this signal was created and when the position initially became active.
Interface PartialLossAvailableNotification
This notification tells you when a trading position has hit a pre-defined loss level, like 10%, 20%, or 30% of the initial investment. It's a way to track potential losses and understand how a strategy is performing.
Each notification includes details like the unique identifier of the signal, the exact time it occurred, and whether it's from a backtest or a live trade. You'll see the trading pair (like BTCUSDT), the strategy used, and the exchange where the trade happened.
Crucially, it provides information about the trade itself: the entry price, the current market price at the time of the loss milestone, and the position type (long or short). You'll also find details related to take profit and stop-loss prices, as well as the initial cost of the trade.
Beyond the basics, the notification gives insights into the position’s health, including peak profit achieved, maximum drawdown experienced, and profit/loss percentages. It also keeps track of how many entries were made (useful if using dollar-cost averaging) and any partial closes that have occurred. Finally, there's an optional field for a note, which allows for a human-readable explanation of the signal's reasoning.
Interface PartialEvent
This data structure represents key information about profit or loss milestones during a trade. It bundles together details like the time of the event, whether it was a profit or loss, and the specific trading pair involved.
You'll find details about the strategy and signal that triggered the trade, along with information about the position itself, including the current market price and the original take profit and stop-loss levels.
It also captures data relevant to dollar-cost averaging strategies, such as the total number of entries and the original entry price before any averaging.
Additional data points like the reason for the signal, timestamps for position activation and signal creation, and whether the trade occurred during a backtest, are included for a comprehensive record of each profit or loss level. Finally, it holds the current unrealized profit and loss and the percentage of partial execution.
Interface OrderSyncOpenNotification
This notification provides detailed information about a newly opened or activated trading position, whether it's from a live trading environment or a backtest simulation. It tells you exactly when and how the position was opened, including whether it was an immediate order or a resting order triggered by a schedule.
You'll find key details such as the unique identifier for the signal, the trading pair, the strategy and exchange involved, and the entry price. It also includes comprehensive performance metrics like profit and loss (PNL), peak profit, maximum drawdown, and related prices, costs, and percentages.
The notification breaks down the trading activity, explaining if it’s an “active” order (immediate fill) or a “schedule” order (resting order placement). It even provides information about the cost of entry and any multiplier or leverage applied. Finally, the notification captures the timestamps of creation and activation, plus any optional notes explaining the reason for the signal.
Interface OrderSyncCloseNotification
This notification tells you when a trading signal has been closed, whether it's because it hit a profit or loss target, timed out, or was closed manually. It’s like getting a report card for a trade.
You'll find key details like the unique ID of the signal, when it was closed, and if it happened during backtesting or live trading. It also includes the trading symbol and the strategy that generated the signal.
The notification also breaks down the financial performance: you'll see the total profit or loss, the highest profit achieved, the maximum drawdown (biggest loss), and how those numbers translate to percentages. You can also see the entry and exit prices used to calculate those values.
The report provides insights into the order details like position type (long or short), and the original entry, take profit and stop-loss prices before any adjustments.
Finally, the notification includes technical details like the number of entries and partial closes, timestamps for signal creation and activation, and the reason the signal was closed – whether it was a profit target, a stop-loss, a timeout, or something else.
Interface OrderSyncCheckNotification
This notification provides updates on the status of an order linked to a trading signal. It's a "ping" sent from the order management system to confirm the order is still active. These pings occur while a signal is being monitored in live mode and help ensure orders stay in sync with the exchange.
The notification includes a wealth of information, such as the symbol being traded, the strategy used, the order type (active or scheduled), and the current market price. It also gives detailed information on pricing, position size, and accumulated profits and losses – including peak profits and maximum drawdowns. You'll find data like original order prices and adjustments from trailing stops.
You'll also see details on how the position has been managed, like the number of entries and partial closes. This data helps you track how the signal is performing, understand potential slippage, and keep a close eye on risk factors.
A key property, backtest, indicates whether the signal originated from a backtest or a live trading environment. Finally, it provides timestamps for key events, allowing you to reconstruct the timeline of a trade.
Interface OrderSyncBase
OrderSyncBase provides the foundational information shared across different order synchronization events within the trading framework. It outlines details such as the type of order being synchronized – whether it's an active order or related to a scheduled signal. This structure gives you essential data like the trading symbol, the strategy that generated the signal, and the exchange used, alongside whether the event originates from a backtest or live trading environment.
You'll also find a unique identifier for the signal, a timestamp, and a precise event time represented as a Date object. Critically, it includes the complete signal data itself and a retry attempt counter, which is automatically managed by the system to handle temporary failures and ensure reliable order execution. This counter helps track consecutive failures and limits the number of retries before a different action is taken.
Interface OrderStopContract
This event signals that a trading order, previously monitored by the system, is now considered finished and will be terminated. It's a final notification about an order, meaning the system has definitively decided to close a position or cancel a pending order.
There are two main reasons why this event is triggered: either the order was found to be missing from the exchange (perhaps it was filled or cancelled elsewhere) or the system reached its maximum number of attempts to confirm the order's status.
The event provides a wealth of information about the order and the associated trading activity, including the trading pair, strategy used, exchange, timeframe, and the signal that generated the order. You’ll find detailed information on the position's performance, like profit/loss, peak profit, maximum drawdown, and the original and adjusted prices for entry, take profit, and stop-loss. It also includes data points like when the signal was created and when the position was initially activated. Note that this event only occurs during live trading, not in backtesting simulations.
Interface OrderStopCheckNotification
This notification signals the end of a check process for either an active order or a scheduled order. It’s a terminal event, meaning it indicates a definitive outcome after a signal has been monitored. Think of it as a final report on the health of a trading signal's order.
It's triggered when the system either can't find the order anymore ("deleted") or has exceeded the allowed number of attempts to check it ("exhausted"). Active orders will be closed, while scheduled orders will be canceled.
The notification provides a wealth of details about the order and the position it represents, including the current price, entry price, profit/loss data, and more. This information gives you a comprehensive snapshot of the position's performance and the conditions leading to its termination. It’s a valuable record for auditing and analysis of trading strategy behavior, especially because it’s only generated in live environments.
Interface OrderRejectOpenNotification
This notification signals that a trading order was definitively rejected by the exchange, meaning it's not worth retrying. It's only triggered when the system definitively fails to place an order – transient errors will retry automatically. This notification provides a wealth of information about the rejected order, including the unique identifier, timestamp, strategy name, exchange involved, and the specific reason for the rejection.
You'll also find details about the current market price, the position's performance (PNL, peak profit, max drawdown), and details about the order itself (type, attempt number, and original prices). It even includes details on the cost of the position, leverage applied, margin mode, trade direction, and how the entry/exit prices were calculated. Essentially, it’s a detailed snapshot of the trading context surrounding a rejected order, to help understand why the order failed and potentially improve future trading strategies.
Interface OrderRejectOpenContract
This event signals that an attempt to open a position or schedule an entry was rejected. It's a definitive refusal – the trading attempt is canceled and the associated signal is used up.
The action property tells you specifically what was rejected: either an attempt to open a position ("signal-open") or a scheduled entry.
The cost property details the total cost associated with the attempted position or entry. This helps understand the financial impact of the rejection.
Interface OrderRejectCloseNotification
This notification signals that a forced close order was rejected by the broker – essentially, the broker couldn't fulfill the close order. It's a live-only event, meaning it only happens during real trading, not backtesting.
The notification provides detailed information about why the close failed, including a human-readable reason from the broker and a unique identifier for the signal. It also includes a snapshot of the position’s performance, including P&L, peak profit, maximum drawdown, and key price points.
You’ll find data about the signal itself like its type, strategy name, trade direction (long or short), and important pricing information.
The notification also covers the details of how the position was managed, like the original take profit and stop-loss prices, as well as any DCA averaging or partial closes that took place. The full history of the position’s performance is captured here, including entries, costs, and timestamps to help understand why the close was rejected.
Interface OrderRejectCloseContract
When a trading strategy attempts to close a position, but the system absolutely cannot fulfill that request, this OrderRejectCloseContract signals that definitive rejection. It means the engine will force a closure using the original reason it was trying to close in the first place.
Think of it as a final "no" – the system couldn't close the position as requested, and it's explicitly stating why.
The action is always "signal-close" to clearly indicate this type of rejection. The closeReason tells you exactly why the closure wasn't possible.
Interface OrderRejectBase
This event signifies that an order has been definitively rejected by the exchange, meaning further attempts are unlikely to succeed. It's a terminal event, not a temporary error that the system will automatically retry. You'll only see this when the system is live, not during backtesting.
The rejection happens when the “onOrderSync” gate resolves to a “rejected” state, indicating a definitive refusal from the exchange, as signaled by an OrderRejectedError. It effectively ends a particular order attempt.
Here's what the information in this event tells you:
- What order was rejected? It specifies whether the rejection concerns an active order (like an opening, activation, or closing trade) or a scheduled order being placed.
- Key identifiers: You’ll find details like the signal ID (which is unique and never repeated), the timestamp, the trading pair (symbol), the strategy name that generated the signal, and the name of the exchange that rejected it.
- Contextual data: Information about the market price at the time of rejection, the strategy's profit and loss (PNL), peak profit, and maximum drawdown is provided.
- Trade specifics: Details about the position (long or short), entry price, take profit, stop loss (both effective and original values), and scheduling/pending timestamps are included.
- Why it was rejected: A human-readable explanation for the rejection is included in the 'message' field, offering insight into the reason provided by the broker adapter.
The “attempt” field indicates how many consecutive times the system tried to execute the order before it was rejected, useful for understanding persistence. This event is crucial for reconciling the position with the actual exchange state because the system won't automatically recover from it.
Interface OrderOpenContract
This event lets you know when a pre-arranged order (like a limit order) has been filled, essentially kicking off a trading position. Think of it as confirmation that your order went through. It's particularly useful if you're connecting this system to external tools that manage orders, allowing them to be kept in sync with what's happening in the backtest or live trading environment.
During testing, this event is triggered based on price movements relative to your initial order price. In a real trading scenario, it’s triggered when the exchange confirms the order’s execution.
The event provides a wealth of information about the trade, including the current market price, accumulated profit and loss (pnl) up to that point, peak profit achieved, maximum drawdown, and all costs associated with the trade. You'll also find details like the initial entry price, take profit and stop loss levels (both original and any adjusted values), and how many times the position was averaged or partially closed. The timestamp of when the signal was scheduled and when the position actually activated is also included. This information helps in auditing, logging, and keeping external systems up-to-date with the trade's progress.
Interface OrderFillOpenNotification
This notification signals that a trade has been confirmed and executed by the exchange – it's a key event after a signal is generated. Think of it as confirmation that your trading strategy’s order has actually gone through. It only happens after the system is absolutely sure the trade happened, meaning it won’t show for failed attempts.
Here's a breakdown of what the data tells you:
- Key Details: You’ll find information like the trade's unique ID, when it happened, the trading pair (like BTCUSDT), and the strategy that triggered it.
- Order Type: It clarifies whether it was a "schedule" order (a resting order placed on the exchange) or an "active" order (a filled order to take a position immediately).
- Performance Data: A snapshot of the trade's current performance is included, like its profit/loss (both in USD and as a percentage), peak profit, and maximum drawdown. This gives you insight into how the trade is performing.
- Pricing Information: You get the effective entry price (potentially averaged with multiple entries), along with your take profit and stop-loss prices.
- Signal Context: The 'note' field provides an optional explanation for why the signal was generated.
Essentially, this notification provides a comprehensive picture of a completed trade, its performance, and the context surrounding it, allowing for in-depth analysis and backtesting.
Interface OrderFillOpenContract
This event signifies that a trading position has been established or an order to do so has been placed. It’s a confirmation from your broker that something happened – either a trade went through immediately ("signal-open") or an order to open a position has been sent to the market and is waiting ("schedule"). The cost property tells you the total amount spent to get into that position.
Interface OrderFillCloseNotification
This notification signals a confirmed order close, meaning the exit order has successfully executed on the exchange. It's a critical piece of information confirming a trade has completed.
Think of it as the final confirmation that your trading strategy's exit plan worked as intended. This notification only happens when the trade closes successfully; rejected or failed attempts won’t trigger it. It’s exclusive to live trading environments.
The notification provides a wealth of details about the closed trade, including:
- A unique identifier for the notification itself and the original signal.
- The exact time the trade was confirmed.
- Key performance metrics like Profit & Loss (PNL), peak profit, and maximum drawdown, all measured in USD and as percentages.
- Details about the entry and exit prices.
- Information about the trade's direction (long or short) and the original order details.
- Reason for the close—whether it was a take-profit, stop-loss, or time-based closure, along with any specific notes.
- Details on the number of entries used for averaging and partial closes executed.
Essentially, it's a comprehensive report card for each completed trade, giving you a complete picture of what happened and how it performed.
Interface OrderFillCloseContract
This describes when a trading position is closed and an order has been filled. It signifies that the broker has confirmed the closing of a trade, whether it was triggered by a take-profit, stop-loss, a time-based event, or a manual closure.
The action property simply identifies this as a 'signal-close' event.
The closeReason provides further context, explaining specifically why the position was closed – for example, was it due to hitting a profit target, a loss limit, or something else?
Interface OrderFillBase
This describes what happens when an order actually gets filled in the backtest-kit framework. It's important to understand that this event—an OrderFillBase—only fires when the broker confirms an order has been executed on an exchange. It doesn't happen during a test run or when an order is initially rejected.
Here's a breakdown of the information provided:
- What is it? It represents a confirmed order execution, like buying or selling an asset. It’s a notification, not an error, and shouldn't affect how the trading engine works.
- When does it happen? This event is generated when a position is opened or closed. It indicates a real trade occurred, not just an order being sent.
- What does the data mean?
type: Tells you if it's a regular position order (active) or a scheduled order (schedule).symbol: The trading pair involved (like BTCUSDT).strategyName: The name of the trading strategy that made the decision.exchangeName: The exchange where the trade took place.signalId: A unique identifier for the signal that triggered the trade.timestamp: When the confirmation occurred.when: A date representation of the timestamp.signal: All the details of the signal that led to the trade.attempt: How many times the order was tried before it was finally confirmed.currentPrice: The price when the order was confirmed.pnl,peakProfit,maxDrawdown: Profit and loss snapshots related to the position.position: Whether the trade was a long (buy) or short (sell).priceOpen,priceTakeProfit,priceStopLoss: The effective entry, profit, and stop-loss prices, potentially adjusted for trailing.scheduledAt,pendingAt: Timestamps related to when the signal was created and the position started.totalEntries,totalPartials: Information about DCA entries and partial closes.
Essentially, OrderFillBase provides a detailed record of a completed trade within the system, giving you insight into the execution and performance of your strategies.
Interface OrderContinueContract
This event signals that the framework is continuing to monitor an order – it hasn’t closed it yet. Think of it as a “still active” notification for your trades. It's triggered periodically while an order remains open and being tracked, letting you know the system is still assuming the trade is valid.
There are two main types of continuation events: active, which relates to a position currently held, and schedule, which refers to a resting order waiting to be filled. The attempt number tells you how many times the framework has briefly detected a problem with the order – if the number is greater than zero, it means the framework is temporarily tolerating a potential issue.
The event provides a wealth of information about the trade, including the symbol, the strategy that initiated it, the exchange used, and the current market price. You'll also find data on the trade’s performance so far, like profit and loss (PNL), peak profit, and maximum drawdown, along with details about entry and exit prices, and the specifics of any averaging or trailing adjustments applied. Finally, you'll get details like the initial signal timestamp and the time the position started. Remember this event only appears in live trading – backtesting doesn't perform these order checks.
Interface OrderContinueCheckNotification
This notification lets you know about the ongoing health of an order, specifically when a check has resolved without immediately closing the position. It's a follow-up to the initial check request and provides a snapshot of the order's status and key metrics. Think of it as a regular update on how your trade is performing.
The system sends these notifications when the order remains open or when a temporary issue is tolerated. These updates are throttled to avoid overwhelming the system.
The notification includes a wealth of information, from the basic details like the trading symbol, strategy name, and signal ID to crucial performance metrics such as P&L, peak profit, and maximum drawdown. It also details pricing information, including original and adjusted prices, and provides insights into how averaging and trailing strategies are impacting the trade. You’ll find details about the number of entries and partial closes as well as timestamps for important events like signal creation and pending status. Finally, there's an optional note field for any custom descriptions added to the signal.
Interface OrderCloseContract
This event notifies you when a trading signal is closed, whether it's because a profit target was hit, a stop-loss triggered, time ran out, or a manual intervention. It's designed to help external systems, like order management tools or audit logs, keep track of what's happening with your trades.
The event provides a lot of information about the closed position, including the current market price at the time of closure, the total profit and loss (both overall and peak values), and details about the initial entry and exit prices. You'll also find information on the original take profit and stop-loss prices before any adjustments like trailing.
It also tells you the direction of the trade (long or short), the time the signal was created and when the position started, and the specific reason why it was closed. Details about any averaging (DCA) and partial closures are also available, so you know exactly how the position was managed.
Interface OrderCheckContract
This event, called OrderCheckContract, is a crucial signal used to verify that orders placed by your trading strategy are still active on the exchange. It's particularly important for ensuring that pending orders (like those waiting for activation) and open positions remain properly tracked.
Think of it as a regular "ping" to the exchange to confirm the order’s status.
When this event happens, you need to respond—either by confirming the order's existence (which keeps the monitoring process going) or by taking action like canceling a scheduled order or closing an open position. Transient errors (like temporary connection problems) are tolerated for a certain number of attempts before a terminal action is taken. This prevents premature cancellations due to temporary network issues.
Backtesting doesn’t generate this event because there’s no real-time exchange connection during backtesting.
The OrderCheckContract event contains detailed information, including the trading pair, strategy name, exchange, timeframe, signal ID, timestamp, current price, unrealized profit and loss (PNL), peak profit, maximum drawdown, entry and stop-loss prices, and DCA details. The attempt property indicates how many consecutive check failures have occurred.
Interface MetricStats
This object holds a collection of statistical data for a particular performance metric. It essentially gives you a comprehensive view of how that metric behaved during a backtest or simulation.
You’ll find details like the total number of times the metric was recorded, the total time it took across all instances, and the average duration. It also includes important values like the minimum and maximum durations observed, as well as measures of variability like the standard deviation and percentiles (95th and 99th).
For metrics that involve waiting periods, you’ll also see statistics about those wait times, covering everything from the minimum to the maximum. Think of it as a single container for all the crucial numerical insights about a specific performance indicator.
Interface MessageModel
This describes the structure of a single message within a chat history used by LLMs. Each message represents something the LLM said or did, and it can be a system instruction, a user's query, the assistant's reply, or the result of a tool being used.
The role property identifies who sent the message - whether it was the system, the user, or the assistant. The content is the actual text of the message, and it might be empty if the assistant’s message only includes tool call information. Some LLMs, like DeepSeek, also provide a reasoning_content field which shows the thought process behind the assistant's response.
If the assistant is using tools, there’s a tool_calls array listing those interactions. You can also include images within a message using the images property, which supports different image formats. Finally, if a message is specifically a response to a tool call, the tool_call_id property identifies which tool call it’s connected to.
Interface MaxDrawdownStatisticsModel
The MaxDrawdownStatisticsModel helps you understand the biggest losses experienced during a trading period. It stores a detailed record of each drawdown event, presented as a list sorted from most recent to oldest. You can also easily see the total number of drawdown events that were tracked. This model essentially provides a clear picture of the potential risks associated with a trading strategy.
Interface MaxDrawdownEvent
This data structure represents a single instance of a maximum drawdown event that occurred during trading. It contains details like when the event happened (timestamp), which asset was involved (symbol), the name of the strategy used, and a unique identifier for the signal that triggered the trade. You’ll also find information about the position itself (long or short), the profit and loss (PNL) of the position, the highest profit achieved, and the depth of the drawdown. The event also includes the price at which the drawdown occurred, the price at which the trade was initially entered, and the take profit/stop loss prices that were set. Finally, it indicates whether this event happened during a backtesting simulation.
Interface MaxDrawdownContract
This describes the information provided when a maximum drawdown is reached during trading. It's essentially a notification that a position has experienced a significant loss from its highest point.
The notification includes the trading symbol, the current price, and a timestamp, along with when the event occurred – this time will be the virtual time during backtests and the actual time during live trading.
You’ll also find details about the strategy, exchange, and timeframe involved, along with the signal that triggered the trade.
A key piece of information is whether the update comes from a backtest (historical data) or a live trading session.
This data helps you monitor risk, adjust strategies, and generally manage positions more effectively by highlighting periods of substantial loss.
Interface LiveStatisticsModel
This model provides a detailed snapshot of your trading performance, calculated from live trade events. It's packed with metrics to help you understand what's working and where you can improve.
The core data is organized around a list of all trade events, including when they started, were active, and closed. You'll find counts of total trades, closed trades, winning trades, and losing trades.
Key performance indicators like win rate, average profit per trade, total profit, and standard deviation (a measure of volatility) are presented. More advanced metrics like Sharpe Ratio (which considers risk), Sortino Ratio (focusing on downside risk), and Calmar Ratio (assessing return relative to drawdown) are also available.
Beyond just profit and loss, the model digs into trade durations, consecutive win/loss streaks, and even analyzes the momentum of price movements with metrics like buyer/seller pressure and trend analysis. You'll also see insights into trade size, measuring the median step size.
Importantly, many of these values will be null if the calculation is unreliable due to unusual market conditions or insufficient data.
Interface InitialDispatchScheduleContract
This describes the initial information sent when a resting order is triggered – essentially, when the system decides it’s time to start monitoring for a specific price. Think of it as the order saying, "Okay, I'm ready to go, here's the details of the signal that prompted this."
The type is always "schedule", confirming it's related to a resting order.
The signal property holds all the data associated with the signal itself. It's a snapshot of all the signal information at the exact moment the order was initially prepared.
Interface InitialDispatchContractBase
This interface describes the common information included when a trading strategy first receives data. Think of it as a package containing essential details about the current trading situation.
It includes things like the trading pair (e.g., BTCUSDT), the name of the strategy running, and the exchange it's connected to. You’ll also find information about whether the execution is a backtest (using historical data) or live trading.
The interface also gives you the current price of the asset, a timestamp indicating when the data arrived, and a more precise "when" time which behaves differently depending on whether it's a backtest or live environment. Effectively, it’s a way to clearly define the context of each trading event.
Interface InitialDispatchActiveContract
This data represents the initial information received when a trading position is opened and becomes active. It’s essentially the confirmation that an order has been filled and the system is now tracking the position.
The type always indicates that this is an "active" position.
You'll find all the relevant details about the signal that triggered the trade within the signal property – things like price, quantity, and any other signal data. This gives you a snapshot of the conditions at the moment the position was established.
Interface InfoErrorNotification
This notification type signals that something went wrong during a background process, but it's not a critical error that will stop everything.
It's designed to help you track down and fix issues without interrupting the backtest.
Each notification has a unique ID, and a detailed error object including a stack trace and other helpful information for debugging.
There's also a clear, human-readable error message so you can understand what happened.
Finally, it's flagged that this error originated from the live environment, not the backtest itself.
Interface IdlePingContract
The IdlePingContract represents notifications that occur when a trading strategy isn't actively responding to any signals. Think of it as a heartbeat letting you know a strategy is in a passive, waiting state.
It's triggered periodically—either every tick or minute—when no signals are being monitored. This provides valuable information for tracking how a strategy moves through its lifecycle.
The contract itself contains several key pieces of data:
- The
symbolbeing traded (like "BTCUSDT"). - The
strategyNamethat's currently idle. - The
exchangeNamehosting the strategy. - The
frameNameused in backtesting scenarios. - The
currentPriceof the asset at the time of the ping. - A
backtestflag to indicate whether the event originated from a historical backtest or live trading. - A
timestampmarking exactly when the ping occurred. - A
whendate object that provides the event time. It is important thatwhen.getTime()is equal totimestamp.
You can subscribe to these idle ping events using listenIdlePing() to receive them continuously, or listenIdlePingOnce() for a single notification.
Interface IWarmCandlesParams
This object holds all the information needed to request and download historical candlestick data. Think of it as a detailed instruction for fetching a specific set of candles. You'll use this when you want to prepare your backtesting environment by ensuring you have all the past data you need.
It specifies things like which trading pair you're interested in (e.g., BTCUSDT), which exchange provides that data, the timeframe of the candles (like 1-minute or 4-hour), and the start and end dates for the historical data you're requesting. Essentially, it tells the system precisely what candles to pre-load.
Interface IWalkerStrategyResult
This interface represents the outcome of running a single trading strategy within a backtest comparison. It holds the name of the strategy you ran, along with detailed statistics about its performance.
You'll find key performance indicators, like overall metrics and rankings, all bundled together in this result. The rank indicates where the strategy stands relative to others in the comparison – a lower rank means better performance. If a strategy's results are invalid for comparison, its metric value will be null.
Interface IWalkerSchema
The IWalkerSchema defines how to set up and run comparisons between different trading strategies. Think of it as a blueprint for an A/B test where you’re trying to see which strategy performs best.
You give it a unique name for easy identification, and can add a note for yourself to remember details later.
It specifies the exchange and timeframe to use for all the strategies you’re testing. Then, you list the names of the strategies you want to compare – these strategies need to be previously registered in the system.
You can also select a metric to optimize, like the Sharpe Ratio (though there's a default if you don’t specify one). Finally, you have the option to add callbacks, which allows you to hook into the testing process at various stages.
Interface IWalkerResults
The IWalkerResults object holds all the information gathered after a complete backtest run comparing different trading strategies. It essentially summarizes the entire testing process.
You'll find details like the specific trading symbol that was analyzed, the exchange platform used for the tests, the name of the backtesting framework (the "walker"), and the timeframe the tests were performed on, all neatly packaged together. This object provides a clear overview of the backtest’s scope and setup.
Interface IWalkerCallbacks
The IWalkerCallbacks interface lets you hook into key events during the backtesting process, allowing you to monitor and respond to what's happening. You can receive notifications when a new strategy begins testing, when a strategy finishes its backtest – including access to performance statistics – or when an error occurs during a strategy's run. Finally, you'll be notified when the entire backtesting run is complete, receiving a summary of all the results. This provides a way to track progress, handle errors gracefully, and gather data throughout the backtesting procedure.
Interface ITrailingTakeCommitRow
This interface represents a single instruction queued for a trailing take commit order. It's essentially a record of what needs to happen – a “trailing-take” action – along with the percentage shift needed and the price when the trailing was initially established. Think of it as a snapshot of a specific adjustment to your trading strategy's take profit levels, triggered by a trailing stop. The percentShift value tells you how much the take profit should move relative to the initial price, and currentPrice serves as a reference point for that calculation.
Interface ITrailingStopCommitRow
This interface represents a single action request related to a trailing stop order. It’s used to queue up changes to trailing stops, ensuring they're processed reliably.
Each commit row indicates a specific action – in this case, a trailing stop adjustment.
You’ll find details about the adjustment, including the percentage shift needed and the price at which the trailing stop was initially established. This information helps track the evolution of the trailing stop strategy.
Interface ISweepTrade
The ISweepTrade interface defines the structure of a single trade executed within the backtesting framework. Each trade record includes information like the originating idea's ID and the author responsible for that idea. It tracks the trading symbol, the direction of the trade (buy or sell), and precise timestamps for both entry and exit.
You can see how long a trade was held, the reason for closing it, and its percentage profit or loss. Crucially, it also records any other ideas that were "absorbed" by this trade – essentially, which signals were prevented from being acted upon because this trade already held that position. This allows for detailed analysis of how different ideas interact and compete for trading opportunities.
Interface ISweepTrack
ISweepTrack represents a single author's performance under a specific trading rule, offering a detailed look at their track record. It's designed to provide continuous data rather than a simple pass/fail judgment, allowing users to decide who to trust based on the raw information. Each ISweepTrack entry contains a complete set of rule parameters and performance metrics for a given author, making it easy to search and analyze.
The track includes information about the rule's parameters – how long the position is held (holdMinutes), when the lock is triggered (profitLockPercent), the stop loss level (hardStopPercent), and the trailing take profit level (trailingTakePercent). It also records the author's author login and their ideas (all directional trades, even those cut short by market data).
Key performance indicators such as hits (trades where the lock or trailing arm activated before the stop loss) and hitRate (hits divided by ideas) are meticulously tracked. The hitRate provides a readily available metric for filtering and assessing an author’s reliability without pre-defined thresholds. This data is presented in a format that encourages flexible user analysis and trust decisions.
Interface ISweepSchema
This schema defines how to register and configure a sweep, which is essentially a set of parameters for testing a trading strategy.
Each sweep needs a unique name to identify it within the system.
It also specifies which exchange to use for fetching historical candle data – be mindful that the exchange must provide exactly the number of candles expected.
You can customize the grid axes, which control how your strategy's parameters are tested across different values. By only defining the axes you want to change, you can leave the others at their default settings.
The reportOrder setting determines how the results of your sweeps are ranked, defaulting to Sharpe Ratio.
Finally, you can attach optional callbacks to different stages of the sweep process, like when the strategy is initially trained, to perform additional actions or logging. These callbacks are completely optional; if you don't provide them, those steps are simply skipped.
Interface ISweepResult
This interface represents the culmination of a backtest simulation. It provides a comprehensive summary of the run, encompassing performance metrics and data about the trades executed.
You'll find information here about the trading symbol used, along with counts of the ideas processed – including those that were directional and those used to build profiles.
It details how long trades were held, giving you average and percentile holding times to understand trade duration patterns. Notably, the 99th percentile holding time reveals any trades that remained open for extremely long periods.
The core of the result is the reports property, which contains a detailed report bucket. This bucket contains the results for each grid point, ranked winners based on performance, and tracks how different authors contributed to the simulation. It allows you to assess the overall effectiveness of the simulation and understand the characteristics of the trades.
Interface ISweepPointReport
This interface, ISweepPointReport, summarizes the performance metrics for a specific grid point during a backtest. It provides a comprehensive overview of trading activity at that point, including how many trades were skipped due to author conflicts.
You'll find key profitability indicators like total and average profit percentages, win rate, and profit factor (gross profit divided by gross loss). It also tracks risk metrics, such as the maximum drawdown, Calmar ratio (annualized profit versus drawdown), and recovery factor (profit versus drawdown).
The report also dives into trade duration, giving you average and percentile holding times. Sharpe and Sortino ratios are included to evaluate risk-adjusted returns, penalizing periods of inactivity. The exitReasons field breaks down trades by how they were closed, while tradesList provides a complete record of all trades executed at that point, enabling detailed investigation into individual trade decisions. This allows you to trace exactly why a trade produced a specific profit or loss.
Interface ISweepParams
The ISweepParams object holds all the settings needed to run a sweep, acting as a central place for configuration. It includes a logger for tracking what’s happening during the sweep, allowing you to see debugging information. You’ll also find the grid axes, defining how the sweep explores different parameter combinations, and a ranking criterion that determines how the results of the sweep are sorted and presented. These parameters are combined with default values and any necessary backend components to ensure everything works smoothly.
Interface ISweepMetricReport
This report represents a complete evaluation of a trading strategy's grid, focusing on a single metric – profit before stop. Think of it as a snapshot of how the strategy performed across different parameter combinations.
The core of the report is a list of grid points, ordered to highlight the most successful configurations.
It also identifies the top-performing combinations based on four different ranking criteria, helping you understand the strategy's strengths.
Finally, it provides a concise summary of the rules (like holding periods or stop-loss strategies) and authors associated with those successful configurations. This allows for quick analysis of the underlying logic driving the best results without having to examine every individual data point. This is a compact record of the trading strategy's author's ideas.
Interface ISweepIdeaProfile
This ISweepIdeaProfile represents the performance history of a single trading idea across a series of candles. Think of it as a detailed record of how an idea played out from start to finish.
It includes the initial entry details like the entry time and price, and a sequence of historical candle data forming the trajectory of the idea. Crucially, this data isn't recalculated for each individual grid point; it's a pre-computed, shared resource.
Alongside the raw data, the profile provides several summary statistics:
- It indicates whether the idea was ultimately successful (a "hit").
- It tracks the maximum positive and negative price movements relative to the entry price.
- It identifies the timing of those movements.
- It pinpoints the deepest "shakeout," representing the greatest adverse price movement before a potential recovery.
- Finally, it presents a median movement statistic – a measure of the typical price movement in the idea’s direction across the entire trajectory.
These summary metrics are meant for assessment and analysis; the grading system doesn't analyze them directly, instead focusing on the raw candle data within a specific holding period.
Interface ISweepIdea
This interface represents a single trading idea, essentially a public prediction made by someone. Think of it as a snapshot of a trader's view on a particular asset. Each idea has a unique identifier, a timestamp indicating when it was published, and specifies the trading pair (like BTCUSDT). It also includes the direction the author believes the price will move and identifies the author of the idea. When running simulations, the framework considers each idea individually, iterating through the price data for that specific idea rather than across a wider grid of possibilities.
Interface ISweepGridPoint
An ISweepGridPoint represents a single location on a grid of trading strategies. It defines the rules for a specific position, including when to exit.
Each point has a hardStopPercent which sets a limit to how much a trade can lose before it’s automatically closed.
A trailingTakePercent determines how a profit target moves as the price increases, creating a dynamic safety net.
The holdMinutes property limits how long a position can be held, regardless of its performance.
Finally, profitLockPercent enables a mechanism to secure profits by setting a price floor and exiting if the price falls back to that level; if disabled, profit locking doesn’t occur.
Interface ISweepGridAxes
The ISweepGridAxes interface defines the possible ranges of values for key trading parameters like hard stops, trailing take profits, hold times, and profit locks. Think of it as outlining how much flexibility you have when setting these parameters during a backtest.
Each parameter (like hardStopPercent, trailingTakePercent, holdMinutes, and profitLockPercent) is represented as a list of possible values. The system systematically tests various combinations of these values to see how they affect the trading strategy's performance.
The "Tunes" section explains what each parameter influences – for example, hardStopPercent controls how much a position can lose before a forced exit. The "Ignored" sections clarify when a particular setting won't be used or actively considered.
The holdMinutes parameter is particularly important as it defines not only the maximum position hold time but also the timeframe used for evaluating the trading strategy's performance.
It’s crucial to understand that every parameter is actively used; there are no silent, unused settings. Any setting’s impact is documented, ensuring transparency in how the backtest evaluates different scenarios.
Interface ISweepCallbacks
This interface lets you hook into the different stages of a backtest simulation run, giving you detailed updates along the way. Think of it as getting real-time notifications about what's happening behind the scenes.
The onProgress callback keeps you informed of the progress within specific phases, like processing profiles or grid points. You'll see how many items have been handled and the total number expected for that phase.
onIdeas tells you the total number of ideas found, and how many of those were directional (excluding neutral ideas).
When idea profiles are built – essentially, after analyzing the data for each idea – onProfiles fires, letting you know how many profiles were created, and if any were incomplete due to candle data limitations.
The onAuthorsTrained callback provides insights into how different grading rules are affecting the performance of individual "authors" or models, revealing their hit rates and other relevant data. This helps you understand how the system is evaluating them.
onGridPoint gives you a detailed report for each grid point that's evaluated, including trade information.
onRanking notifies you when a ranking is complete, showing the sorted reports based on a specific criterion and identifying the top performer. This occurs once for each ranking criterion.
Finally, onDone signals the successful completion of the entire simulation, passing along the overall result.
Interface ISweepBest
ISweepBest represents a single top-ranked result within a sweep. It focuses solely on the criterion used for ranking and provides a reference to the full report associated with that ranking.
Think of it as identifying which criterion led to this particular winning point.
The actual trades involved and other tracking information aren't stored here to avoid redundancy; they're found within the linked report and the bucket's tracking data.
You'll find the criterion property defines the specific ranking rule applied, and report points to the comprehensive report containing details about the winning point. If no points were assessed, the report will be null.
Interface ISweepAbsorbedIdea
This describes what happens when a trading idea isn’t executed because a previous trade by the same author already occupies the available slot. This "absorbed idea" represents a signal that didn't result in a trade.
The absorbed idea includes the unique identifier of the idea itself and the author who created it. This allows for straightforward analysis of the author's activity without needing to combine data from different sources. Essentially, it tracks ideas that were blocked due to existing positions held by the same author.
Interface ISweep
The ISweep interface provides a way to execute a complete trading simulation. Think of it as initiating a full run of the backtest process. You provide a trading symbol and a list of predefined trading ideas, and the system will then perform a series of steps – first, it filters potential strategies based on your chosen profiles, then narrows them down with author filters, and finally evaluates them using a grid system to determine their overall rankings. The result of this entire process is returned to you in a structured format, detailing the simulation outcomes.
Interface IStrategyTickResultWaiting
This result type indicates a scheduled trading signal is currently paused, awaiting a specific price level to be reached before it can be executed. It’s a recurring signal, unlike the initial “scheduled” signal you receive when a signal is first created.
The data provided within this result includes details like the signal itself, the current price being monitored, and identifiers for the strategy, exchange, timeframe, and trading symbol involved. You'll also find information related to potential profit and loss calculations (though these are theoretical, as the position hasn't been activated yet), confirmation of whether it’s a backtest or live execution, and the timestamp of the event. This allows you to track the status of pending signals and understand the context of the wait.
Interface IStrategyTickResultScheduled
This interface represents a specific event within a trading strategy – when a signal is generated and scheduled, meaning it's waiting for the price to reach a certain level before being executed. Think of it as the system acknowledging a potential trade has been identified and is on hold.
Each IStrategyTickResultScheduled object contains important details about that signal, including the signal itself (signal), the name of the strategy that generated it (strategyName), and information about the exchange, timeframe, and trading pair involved. You’ll also find the price at which the signal was created (currentPrice), whether the event occurred during a backtest (backtest), and a timestamp (createdAt) marking when the signal was scheduled. This data allows for comprehensive tracking and analysis of how and when signals are being generated.
Interface IStrategyTickResultOpened
This interface describes the result you receive when a new trading signal is created within the backtest-kit framework. Think of it as a notification that a signal has been successfully generated and saved.
It includes key details about the signal itself, such as the signal's ID and the strategy, exchange, and timeframe involved. You'll also find information like the current price at the time the signal was opened, whether it's part of a backtest or a live trade, and a timestamp indicating when this event occurred. This information is valuable for monitoring signal creation and understanding the context in which trades are being initiated.
Interface IStrategyTickResultIdle
This interface describes what happens when a trading strategy is in an idle state, meaning it's not currently generating any trading signals. It provides details about the conditions at the time of the idle state, helping you monitor and understand your strategy's behavior.
You'll find information like the strategy's name, the exchange it's connected to, the timeframe being used, and the trading pair involved.
Crucially, it also includes the current price, whether the data is from a backtest or live execution, and a timestamp indicating when this idle state occurred. This lets you trace back and analyze why your strategy entered an idle phase and what the market conditions were like at that moment.
Interface IStrategyTickResultClosed
This interface represents the result when a trading signal is closed, providing a snapshot of the signal's final state and financial performance. It includes key details like the reason for the closure – whether it was due to a time limit, hitting a profit or loss target, or a manual close.
You'll find essential information here, such as the closing price, the exact time the signal closed, and a breakdown of the profit or loss, considering factors like fees and slippage. It also keeps track of the strategy and exchange used, along with the trading pair and timeframe.
A special identifier, closeId, is available for user-initiated signal closures. Finally, it clearly indicates whether the event occurred during a backtest or a live trading session and records when the result itself was generated.
Interface IStrategyTickResultCancelled
This interface, IStrategyTickResultCancelled, represents a situation where a planned trading signal was cancelled before a trade actually happened. This can happen if a signal is scheduled but then doesn't trigger, or if a stop-loss is hit before the entry point.
The action property clearly identifies this as a 'cancelled' event. You'll find the details of the original signal in the signal property.
Important data points about the cancellation itself, like the currentPrice at the time of cancellation and the exact closeTimestamp, are also included. Tracking information such as the strategyName, exchangeName, frameName, and symbol help with analysis and debugging.
The backtest flag tells you if this event occurred during a backtest or a live trading session.
The reason property provides more context as to why the signal was cancelled. A cancelId is available if the cancellation was initiated manually, for example, if you used a cancellation function. Finally, the createdAt property records when the result was generated, linking it back to the candle or the execution context.
Interface IStrategyTickResultActive
This interface describes a tick result that occurs when a strategy is actively monitoring a signal, awaiting a take profit (TP), stop loss (SL), or time expiration.
It contains key information about the situation, including the signal being monitored, the current price used for evaluation, and the strategy and exchange names for tracking purposes. You'll also find details like the symbol being traded, the progress towards TP and SL, the unrealized profit and loss (PNL) taking into account fees and slippage, and whether the data comes from a backtest or live trading. Finally, timestamps are included to track when the event occurred and when the last candle was processed for backtesting purposes.
Interface IStrategySchema
This defines the structure for registering a trading strategy within the backtest-kit framework. Think of it as a blueprint for how a strategy generates trading signals.
Each strategy needs a unique name for identification. You can also add a note for your own documentation.
The interval property controls how often the strategy can generate signals, helping to prevent it from overwhelming the system. By default, signals are generated at least every minute.
The core of the strategy is the getSignal function. This function takes the symbol, a timestamp, and the current price to determine whether a buy or sell signal should be generated. You can create signals that are triggered when a price reaches a specific level.
Optional callbacks can be added for events like trade openings and closures, allowing you to track or react to specific actions.
You can associate a risk profile with the strategy for risk management purposes, or even multiple risk profiles if needed. It's also possible to tag the strategy with action identifiers.
Finally, a custom information object can be included to facilitate monitoring and other data-driven applications.
Interface IStrategyResult
The IStrategyResult represents a single result from running a trading strategy backtest. It's designed to hold all the information needed to compare different strategies against each other.
Each result includes the strategy's name so you know which one it is. You also get comprehensive statistics about the backtest itself, giving you a deep dive into the strategy's performance.
A key piece of information is the metric value, which is used to rank strategies – think of it as a performance score. If a strategy didn't generate any signals, you'll see null values for the timestamps marking the first and last signals.
Interface IStrategyPnL
This interface, IStrategyPnL, neatly packages the results of a trading strategy's profit and loss calculation. It gives you a clear picture of how your strategy performed, factoring in realistic trading conditions.
The pnlPercentage tells you the percentage gain or loss – a positive number means profit, a negative number means a loss.
You’ll also find the priceOpen and priceClose, which represent the entry and exit prices, respectively, but adjusted to account for fees and slippage – making them more reflective of what you’d actually receive.
pnlCost shows the absolute dollar amount you made or lost on the trade, calculated based on the total amount invested. Finally, pnlEntries represents the total capital you committed to the trade.
Interface IStrategyCallbacks
This interface provides a way to customize how your trading strategy reacts to different events throughout a signal's lifecycle. You can define functions to be triggered when a signal is opened, becomes active, goes idle, is closed, or is scheduled for later execution. There are also callbacks for when signals are cancelled, written to storage for testing, or enter partial profit or loss states. The onTick function lets you respond to every market tick, while onSchedulePing and onActivePing allow for more frequent monitoring of scheduled and active signals, respectively, enabling custom checks and adjustments. These callbacks allow you to build very responsive and tailored trading logic.
Interface IStrategy
The IStrategy interface defines the core methods a trading strategy needs to execute. It handles things like responding to price ticks, retrieving signals, checking for breakeven points, and monitoring the position's status.
Here's a breakdown of what it offers:
Core Execution:
tick: Processes each new price update, checking for signals and TP/SL conditions.getPendingSignal&getScheduledSignal: Retrieve active signals for a symbol (returns null if none).getBreakeven: Determines if a signal has reached a breakeven point based on transaction costs.getStopped&getPaused: Checks if the strategy is stopped or paused, which impacts processing.setPaused: Allows pausing/resuming new position openings.
Position Management & Monitoring:
getTotalPercentHeld: Calculates how much of the position is still open.getRemainingCostBasis: Tracks the remaining cost basis of the position.getPositionEffectivePrice: Calculates the average entry price for a position.getPositionInvestedCount,getPositionInvestedCost,getPositionPnlPercent,getPositionPnlCost: Provide detailed data about the position’s financial status.getPositionEntries: Shows the history of entry prices and costs for a position.getPositionPartials: Logs the history of partial profit/loss takes.
Backtesting & Control:
backtest: Allows you to run the strategy against historical data.stopStrategy: Prevents the strategy from generating new signals (without closing current positions).cancelScheduled&activateScheduled: Control scheduled signal execution.closePending: Closes the current position without stopping the strategy.createSignal: Allows manually queuing signals.createTakeProfit&createStopLoss: Report external fills to bridge real-world and simulated conditionspartialProfitandpartialLoss: Let users take partial profits or losses.breakeven: Moves the stop-loss to breakeven when conditions are met.trailingStop: Adjusts the trailing stop-loss distance.trailingTake: Adjusts the trailing take profit distance.
Status & Information:
hasPendingSignal&hasScheduledSignal: Check for active signals.getStatus: Returns a snapshot of the strategy's state.- A variety of
get...Minutesmethods track time-related metrics for the position. - Several
get...Price&get...Pnlmethods provide details about the position's performance.
The dispose method cleans up resources when the strategy is no longer needed. This interface is designed to be flexible and provides plenty of data and control for monitoring and managing the strategy’s lifecycle.
Interface IStorageUtils
This interface defines the core methods that any storage adapter used within the backtest-kit trading framework must provide. Think of it as the blueprint for how your storage system will interact with the backtesting process.
It includes methods to react to different signal lifecycle events like when a signal is opened, closed, scheduled, or cancelled.
You’ll also find methods for retrieving signals – finding one by its unique ID or listing all signals in storage.
Finally, there are methods to handle "ping" events—specifically active and schedule pings—which are used to update the timestamp of signals that are currently open or scheduled. These ensure your data reflects the signal's current state.
Interface IStorageSignalRowScheduled
This interface represents a signal stored in your backtest, specifically when it's been scheduled for a future action.
It tells you the signal’s current status, which will always be marked as "scheduled" in this context.
You'll also find the price at the time the signal was scheduled, which is the same price recorded in the related strategy tick result. This price helps you understand the market conditions that triggered the signal.
Interface IStorageSignalRowOpened
This interface represents a single row of data when a trading signal is opened.
It tells you that the signal has transitioned to an "opened" state.
Alongside that status, it provides the current VWAP price at the time the signal was opened, which is handy for tracking performance and analyzing trade entry points. Think of it as a snapshot of the market conditions when the trade began.
Interface IStorageSignalRowClosed
This interface describes a signal that has been closed, meaning it's no longer active. It contains all the information about how the signal performed when it was closed.
You'll find details like the signal's final profit and loss (PNL), the closing price, and the reason why the signal was closed. It also includes the exact timestamp of when the signal closed. This data is essential for analyzing past performance and understanding what led to those results.
Interface IStorageSignalRowCancelled
This interface describes a signal row that has been marked as cancelled. It essentially signifies that a signal, previously active or planned, is no longer valid or being considered. The status property is always set to "cancelled", providing a clear indication of the signal's state. This allows tracking and filtering of signals that are no longer relevant for trading decisions.
Interface IStorageSignalRowBase
This interface defines the foundational structure for how signal data is stored, regardless of its specific status. It ensures that every signal record includes key information like when it was initially created and last updated, using timestamps derived from strategy execution results. A priority field is also included, which helps manage the order in which signals are processed – it’s currently set using the current time, making it consistent whether you're running a live trading scenario or a backtest. Think of it as a way to ensure signals are handled in a predictable sequence.
Interface IStateInstance
The IStateInstance interface provides a way to manage mutable data associated with individual trading signals. It's designed to help strategies, particularly those using LLMs, track key metrics over a trade's lifetime, such as unrealized profit and loss, the duration the position has been open, and levels at which a trade might be considered failing. Think of it as a container for keeping track of a trade's performance as it unfolds.
The interface includes methods for initializing the state, retrieving its current value (with a built-in safeguard against looking into the future), and updating it. Crucially, updates with earlier timestamps will overwrite existing data, allowing backtests to restart without causing problems. Finally, a dispose method is available to release any resources used by the state instance.
Interface ISizingSchemaKelly
This schema defines a sizing strategy based on the Kelly Criterion, a formula used to determine optimal bet sizes. It’s a way to manage risk and maximize growth by calculating how much of your capital to allocate to each trade. The method is always set to "kelly-criterion" to identify this specific sizing approach. You’ll also specify a kellyMultiplier, which controls how aggressively you apply the Kelly Criterion; a lower value like 0.25 represents a more conservative, quarter-Kelly approach, while higher values are riskier.
Interface ISizingSchemaFixedPercentage
This schema defines a trading sizing strategy where each trade size is determined by a fixed percentage of your available capital. You specify this percentage with the riskPercentage property; for example, a riskPercentage of 2 would mean risking 2% of your total capital on each individual trade. The method property is set to "fixed-percentage" to identify this particular sizing approach. It's a simple and straightforward way to manage risk by consistently risking a set portion of your funds with every trade.
Interface ISizingSchemaBase
This interface defines the fundamental structure for sizing configurations within the backtest-kit framework. Every sizing schema will have a unique identifier, referred to as sizingName, to distinguish it from others. You can also add a note for your own records or documentation.
The schema also enforces limits on position sizing. maxPositionPercentage caps the size of a position as a percentage of your total account balance, while minPositionSize and maxPositionSize set absolute minimum and maximum trade sizes.
Finally, callbacks allows you to optionally define functions that will be triggered at specific points in the sizing process, giving you more granular control.
Interface ISizingSchemaATR
This schema defines how to size trades based on the Average True Range (ATR).
It's designed for strategies that want to adjust position size based on market volatility, as measured by the ATR.
You’ll specify a method, which must be "atr-based," and a risk percentage – this is the portion of your capital you're willing to risk on each trade.
Finally, you set an ATR multiplier, which is used to calculate how far your stop-loss should be placed from the entry price, directly influenced by the current ATR value. This multiplier helps dynamically adjust risk exposure to account for varying market conditions.
Interface ISizingParamsKelly
This interface defines the parameters used for sizing trades using the Kelly Criterion method. It primarily includes a logger to help you keep track of what's happening during the sizing process, which is useful for debugging and understanding how your sizing strategy is behaving. The logger allows you to output information and insights, giving you better visibility into the sizing calculations.
Interface ISizingParamsFixedPercentage
This interface defines the basic information needed to control how much of an asset to trade using a fixed percentage of your available capital. It primarily includes a logger, which is helpful for keeping track of what's happening during trading. You'll use this when setting up your trading strategy to ensure consistent risk management by allocating a predetermined portion of your funds to each trade. Think of it as a core piece of information for determining your trade size.
Interface ISizingParamsATR
This interface, ISizingParamsATR, helps you configure how much of your capital you'll allocate to a trade when using an ATR (Average True Range) based sizing strategy. It's mainly used when creating a ClientSizing object, which is responsible for calculating trade sizes.
You'll find a logger property here, which lets you hook in a logging service to receive diagnostic messages related to the sizing process – useful for debugging and monitoring. Think of it as a way to get insights into what's happening behind the scenes when your trades are being sized.
Interface ISizingCallbacks
The ISizingCallbacks interface provides a way to hook into the sizing process within the backtest-kit framework. Specifically, you can use the onCalculate function to observe and potentially influence the size of each trade just after it's been determined. This is helpful for keeping track of sizing decisions or verifying that calculations are behaving as expected. Think of it as a chance to peek inside the sizing logic and ensure everything's aligned with your strategy.
Interface ISizingCalculateParamsKelly
When determining your trade size using the Kelly Criterion, this object defines the key inputs needed for the calculation. You'll specify the method as "kelly-criterion" to indicate you're using this approach. The winRate represents the probability of winning a trade, expressed as a number between 0 and 1. Finally, winLossRatio tells the system the average profit you make when you win compared to the average loss when you lose.
Interface ISizingCalculateParamsFixedPercentage
This interface defines the parameters needed when you want to size your trades based on a fixed percentage of your account balance. Essentially, you're telling the system to risk a predetermined percentage with each trade. The method property confirms you’re using the fixed-percentage sizing approach. You'll also need to specify the priceStopLoss, which is the price level at which your stop-loss order will be triggered, crucial for defining your risk.
Interface ISizingCalculateParamsBase
This interface defines the basic information needed to determine how much of an asset to trade. Every sizing calculation – that is, figuring out your position size – will need to know the trading pair you're dealing with, like "BTCUSDT." It also requires knowing your current account balance and the price at which you intend to enter the trade. Think of it as the foundation for deciding how much to invest in a given trade.
Interface ISizingCalculateParamsATR
This interface defines the settings needed for calculating trade sizes using the ATR (Average True Range) method.
It requires you to specify that the sizing method is "atr-based".
You'll also need to provide the current ATR value, which represents the average of the true ranges over a specified period. This value helps determine the appropriate position size based on market volatility.
Interface ISizing
The ISizing interface defines how a trading strategy determines the size of each position it takes. It's a core component of the backtest-kit framework, responsible for figuring out how much to buy or sell.
The calculate property is the most important part – it’s a function that receives information about the trade (like your risk tolerance, the price of the asset, and other relevant data) and then returns the calculated position size, usually a number representing the quantity of shares or contracts to trade. This function handles the complex logic of position sizing, ensuring trades are aligned with your risk management rules.
Interface ISignalRow
This interface, ISignalRow, represents a complete signal ready for execution within the trading framework. Think of it as a finalized order with all the necessary details. Each signal gets a unique ID, and it includes information like the cost of the trade, the entry price, and the expected duration.
It also carries important configuration details. You specify how much leverage to use (the multiplier) and whether you want to use isolated margin (isolated). There's space for custom data (payload) and identifiers for the exchange, strategy, and market timeframe.
Beyond the basics, the signal keeps track of its history. This includes partial closes for more accurate profit/loss calculations, a record of DCA entries if applicable, and trailing stop-loss and take-profit prices for dynamic adjustments. It also remembers the best (peak) and worst (fall) prices seen during the trade’s lifecycle to track performance. Finally, it records creation and pending timestamps for auditing and analysis.
Interface ISignalIntervalDto
The ISignalIntervalDto helps manage how trading signals are delivered, especially when you need them in batches. Think of it as a way to group signals together so they aren't all sent individually. It pauses the release of the next signal until a specified time interval has passed. Each signal within this grouped delivery has a unique identifier, a UUID, which distinguishes it.
Interface ISignalDto
The ISignalDto represents a trading signal, essentially the instructions for a trade. Think of it as a standardized way to communicate what needs to be done. Each signal has a unique identifier, either provided by you or automatically created.
It includes details like the ticker symbol being traded, whether to go long (buy) or short (sell), and a note explaining the reasoning behind the signal. You can also add custom data to the signal using the payload field, allowing you to attach extra information for tracking or analysis.
Crucially, it specifies entry and exit prices – the price to buy or sell at (priceOpen), your target price for profit (priceTakeProfit), and a safety net price to limit losses (priceStopLoss). You also set a time limit for how long the position should remain open.
The cost field represents the amount spent on entering the position, and multiplier controls the leverage applied. Finally, isolated specifies whether the position uses isolated margin, which provides an extra layer of protection against liquidation.
Interface ISignalCloseRow
This interface, ISignalCloseRow, builds upon the existing ISignalRow and adds important details when a signal is closed by a user's action. It introduces two new properties: closeId which uniquely identifies the user-initiated closure, and closeNote, which allows users to provide a brief explanation or reason for the closure. Think of this as a way to track and add context when a trading signal is manually closed instead of automatically. These properties are only relevant when the closing of the signal is triggered by user intervention.
Interface ISessionInstance
This interface outlines how different backend systems (like local storage, persistent storage, or even dummy data) manage temporary information during a backtest run. Think of it as a container for data that's specific to a particular symbol, trading strategy, exchange, and timeframe. It’s meant to hold things that need to be remembered and accessed within a single backtest run, such as results from machine learning models or intermediate calculations.
You can use waitForInit to get the session ready to go. setData lets you store new pieces of information along with a timestamp to know when that data was valid. getData allows you to retrieve that information, but it makes sure you're not looking into the future to prevent skewed results. Finally, dispose cleans up any resources used by the session when it’s no longer needed.
Interface IScheduledSignalRow
This interface defines a signal that's waiting for a specific price to be reached before it's activated. Think of it as a signal that’s delayed – it's not triggered immediately, but waits until the market price hits a target level. It builds upon a standard signal and represents a pending signal that's waiting for that price.
Once the target price is achieved, this delayed signal essentially transforms into a normal, active signal. The time it was initially scheduled is tracked, and the actual time it started waiting is recorded.
The core piece of information here is the priceOpen, which is the specific price level the market needs to reach before the signal is triggered.
Interface IScheduledSignalCancelRow
This interface defines a scheduled signal that can be cancelled, specifically when a user initiates the cancellation. It builds upon the standard scheduled signal information, adding details about the cancellation itself. You'll find a cancelId which uniquely identifies the cancellation request and a cancelNote which allows for including a user-provided explanation for the cancellation. Think of it as a way to track and understand why a scheduled signal was cancelled by a user.
Interface IScheduledSignalActivateRow
This interface defines a row of data representing a scheduled signal that might be activated. It builds upon a base signal row by adding details specific to user-triggered activations. If a user manually initiates the activation of a scheduled signal, this interface includes an activateId to identify the activation event and an activateNote to provide any additional context from the user's request. These extra fields are not present for signals that are automatically activated.
Interface IRuntimeRange
This interface, IRuntimeRange, simply holds the start and end dates that define the timeframe for your backtesting simulations. Think of it as setting the boundaries of the historical data you’re using to test a trading strategy. The from property specifies the beginning date, and the to property specifies the ending date. It helps clearly establish the period your strategy will be evaluated against.
Interface IRuntimeInfo
The IRuntimeInfo interface provides essential details about the environment your trading strategy is operating in. Think of it as a snapshot of the current conditions. You'll find information like the symbol being traded – for example, BTCUSDT – and the time period being analyzed during a backtest.
It also contains extra data that your strategy might need, providing custom information for monitoring or reporting. Contextual details such as the exchange, strategy, and frame names are available too, helping you understand the execution environment.
You'll also have access to the precise timestamp, the current market price, and a flag to confirm whether the strategy is running as a backtest or in live mode. It gives you a comprehensive view of the runtime conditions.
Interface IRunContext
The IRunContext interface acts as a central hub of information when running code within the backtest-kit framework. Think of it as a package containing everything a function needs to know about its surroundings. It bundles together details about the routing of your trading strategy - things like the exchange, strategy, and frame – alongside runtime data, such as the trading symbol and timestamp. Essentially, it's designed to be a single, convenient object that provides a complete picture of the current situation during a backtest or live trade.
Interface IRiskValidationPayload
This data structure holds the information needed when validating trading decisions to make sure everything is within acceptable risk levels. It builds upon the basic check arguments and adds details about the current market situation and your portfolio.
Specifically, it includes the currentSignal which represents the trade signal being evaluated – it contains all the necessary price data. You'll also find the activePositionCount, simply telling you how many trades are currently open. Finally, the activePositions property gives you a detailed list of all those active positions, providing more granular insight into your exposure.
Interface IRiskValidationFn
This defines the shape of a function used to check if a trading strategy's risk parameters are acceptable. Think of it as a gatekeeper ensuring your trades won't lead to unwanted consequences. If the validation passes – meaning everything looks good – the function should simply do nothing or return null. However, if something is amiss, it needs to signal that failure, either by returning a structured rejection reason (IRiskRejectionResult) or by throwing an error, which the system will then handle for you.
Interface IRiskValidation
This interface lets you define how to validate risk-related data, like position sizes or margin requirements. You provide a function – validate – that will actually perform the check, and optionally add a note to explain what that validation is doing and why it's important. Think of it as a way to put rules and explanations together for keeping your trading safe and understandable.
Interface IRiskSignalRow
This interface, IRiskSignalRow, builds upon the existing ISignalDto to provide crucial details needed for risk management calculations. It specifically includes the entry price (priceOpen) alongside the initially set stop-loss (originalPriceStopLoss) and take-profit (originalPriceTakeProfit) levels when the trade signal was generated. Think of it as containing the original pricing information that's vital for verifying risk parameters during the trading process. These values ensure you're tracking the initial risk plan for each position.
Interface IRiskSchema
The IRiskSchema helps you define and manage risk controls for your portfolio. Think of it as a way to create custom rules that ensure your trading strategy stays within safe boundaries. Each risk schema has a unique identifier, and you can add notes to explain the purpose of the rules.
You can also specify callbacks to be triggered at certain points, like when a trade is rejected or allowed based on your risk checks. The heart of the schema lies in its validations - these are the custom functions or objects that define the specific rules you want to enforce. This lets you tailor your risk management to the precise needs of your trading strategy.
Interface IRiskRejectionResult
This interface describes the outcome when a risk check fails. It provides a unique ID to track the specific rejection and a clear explanation, written for humans, detailing why the validation didn't pass. Think of it as a notification explaining what went wrong and allowing for easier troubleshooting.
Interface IRiskParams
This interface defines the information needed to manage risk during trading, whether it's a simulation (backtest) or live trading. It includes the name of the exchange you're trading on, a way to log debugging information, and a service to keep track of time accurately, preventing issues like looking into the future.
You'll also find a flag indicating whether you're in backtest mode.
Finally, there's a special callback function that gets triggered when a trading signal is blocked by risk rules. This callback allows you to handle the rejection, potentially reporting it or taking other actions, before the system proceeds with other operations.
Interface IRiskCheckOptions
To help with managing risks when multiple parts of your trading strategy are trying to adjust positions at the same time, this configuration option lets you temporarily mark a position as being used. This ensures that other processes attempting to make changes see the updated position size before any final changes are applied, preventing potential conflicts. Think of it as a short reservation to make sure everyone's working with the most current information and avoiding double-booking.
Interface IRiskCheckArgs
The IRiskCheckArgs interface holds all the information needed to decide whether a trading strategy should be allowed to generate a new signal. Think of it as a safety check performed before a signal is actually created. It gathers details like the trading symbol, the pending signal itself, the strategy's name, the exchange being used, a risk identifier, the timeframe being analyzed, the current market price, and a timestamp. All this data is passed directly from the client strategy context, allowing risk management logic to make informed decisions about trading opportunities.
Interface IRiskCallbacks
This interface defines optional functions you can use to receive notifications about the results of risk checks within the backtesting system. Specifically, onRejected is called when a trading signal is blocked due to exceeding risk limits, letting you know a trade isn't going through. Conversely, onAllowed is triggered when a signal successfully passes all risk assessments, signaling that a trade is approved. You can use these callbacks to monitor and react to risk management decisions in real time during your backtests.
Interface IRiskActivePosition
This interface describes a single, active trading position that a strategy is currently holding. It’s essentially a snapshot of what’s happening in the market for a specific strategy.
Each position record includes key details like the strategy's name, the exchange being used, and the trading symbol (like BTCUSDT). You’ll also find information about the position’s direction – whether it’s a long or short trade – along with the entry price, stop-loss, and take-profit levels.
Finally, the record keeps track of how long the position has been open and when it was initially created. This information helps in analyzing risk across different strategies and markets.
Interface IRisk
The IRisk interface is responsible for managing risk and tracking positions in your trading strategies. It provides functions to verify if a trading signal is permissible based on predefined risk limits.
checkSignal lets you confirm if a signal aligns with your risk rules. checkSignalAndReserve is a safer version of checkSignal – it not only verifies the signal but also temporarily sets aside space for the potential position, guaranteeing that concurrent strategies don’t accidentally exceed limits. It's critical to follow up checkSignalAndReserve with either adding the signal (addSignal) or canceling it (removeSignal) to keep the risk tracking accurate.
addSignal is used to record the details of a newly opened trade, and removeSignal cleans up the records when a trade is closed.
Interface IReportTarget
This interface lets you fine-tune which details get recorded during your trading simulations. Think of it as a way to control the level of detail in your reports.
You can choose to log events related to strategy execution, risk management, breakeven points, partial order fills, performance metrics, scheduling, live trading activity, backtest finalization, signal synchronization, or milestones like reaching the highest profit or experiencing the maximum drawdown. Each property represents a different category of data, and setting it to true activates logging for that specific type. This allows you to focus on the aspects of your trading that are most important to analyze.
Interface IReportDumpOptions
This interface lets you control what data gets written to reports during backtesting. Think of it as a way to tag and categorize your results. Each property represents a specific piece of metadata, like the trading symbol (e.g., BTCUSDT), the name of the strategy being used, or the exchange the data originated from. You can use these properties to filter and search your reports later, making it easier to analyze specific scenarios or strategies. It helps organize your backtesting results for better analysis and understanding of performance.
Interface IRecentUtils
This interface defines how different systems can manage and access recent trading signals. It provides a standard way to store and retrieve the most up-to-date signals for a particular trading strategy and market.
The handleActivePing method is used to record new signal events, ensuring the system always has the latest information. getLatestSignal allows you to fetch a signal, but it includes a safety check to prevent looking into the future by ensuring the signal's timestamp isn’t later than the time you’re interested in. Finally, getMinutesSinceLatestSignalCreated calculates how long ago a signal was generated, which can be useful for timing and analysis.
Interface IPublicSignalRow
This interface, IPublicSignalRow, provides a way to share detailed information about a trading signal with external systems or users. It builds upon the basic ISignalRow by adding visibility into the initial stop-loss and take-profit prices that were set when the signal was created. This is important because, even if those prices are adjusted later through trailing stop-loss or take-profit mechanisms, you want to be able to see what the original targets were.
Here's a breakdown of what's included:
- Cost: The initial cost of entering the position.
- originalPriceStopLoss: The initial stop-loss price, which doesn't change even if the effective stop-loss changes later.
- originalPriceTakeProfit: The initial take-profit price, also unchanging regardless of trailing take-profit.
- partialExecuted: Shows the total percentage of the position that has been closed through partial executions.
- totalEntries: Indicates how many times the position has been averaged (how many entries were made).
- totalPartials: The number of partial closes that have been executed.
- originalPriceOpen: The initial entry price, unaffected by averaging.
- pnl: The current, unrealized profit/loss.
- peakProfit: The highest profit achieved during the trade.
- maxDrawdown: The largest loss incurred during the trade.
Essentially, IPublicSignalRow gives you a complete snapshot of a signal's history and performance, including both the original settings and their current status.
Interface IPublicCandleData
This interface describes the standard format for candlestick data used within the backtest-kit framework.
Each candle represents a specific time interval and includes key price points like the opening price, the highest price reached, the lowest price seen, and the closing price. The timestamp indicates exactly when this candle's period began. Finally, the volume property tells you how much trading activity occurred during that candle's duration.
Interface IPositionSizeKellyParams
This interface defines the settings you'll use when calculating your position sizes based on the Kelly Criterion. It helps you tell the backtest-kit how to determine how much to bet or trade based on your expected win rate and how much you typically make versus lose when you win or lose. You provide two key numbers: your win rate (a value between 0 and 1, representing the percentage of time you expect to be right) and your average win/loss ratio (how much you win for every dollar you lose). These parameters help the system automatically determine an appropriate position size for each trade.
Interface IPositionSizeFixedPercentageParams
This defines the parameters needed for a trading strategy that uses a fixed percentage of your available capital for each trade.
Specifically, you’ll need to specify the priceStopLoss, which represents the price at which you'll implement a stop-loss order to limit potential losses. This parameter helps manage risk by automatically exiting a trade if it moves against your expectations.
Interface IPositionSizeATRParams
The IPositionSizeATRParams interface holds the settings needed for calculating position sizes based on the Average True Range (ATR). It’s primarily used to define how much of your capital you'll risk on a trade, using the ATR as a guide. The most important piece of information it contains is the atr value, which represents the current ATR reading – a measure of volatility. This value directly influences how much you’ll trade.
Interface IPositionOverlapLadder
This defines how to identify overlapping positions when using dollar-cost averaging (DCA). It lets you set boundaries, expressed as percentages, to determine what constitutes an overlap.
The upperPercent property controls how much above each DCA level is considered an overlap – a higher value means more tolerance.
Conversely, lowerPercent defines how much below each DCA level triggers an overlap notification – a larger value expands the overlap zone downwards.
These percentages help fine-tune your overlap detection based on your specific trading strategy.
Interface IPersistStrategyInstance
This interface defines how a strategy's data can be saved and loaded later, especially when dealing with complex strategies that might need to remember information between runs. Think of it as a way to give each strategy a dedicated space to store its progress.
If you want to customize how a strategy's state is saved – perhaps using a database instead of a file – you can create an adapter that implements this interface.
The waitForInit method is like a preparation step, ensuring everything is ready to store data. The readStrategyData method retrieves any previously saved data, and writeStrategyData is used to save the current state of the strategy. Passing null to writeStrategyData will clear out any existing saved data.
Interface IPersistStorageInstance
This interface helps manage how trading signals are saved and loaded, specifically for either backtesting or live trading. Think of it as a way to customize where and how your signals are stored, instead of relying on the default file-based system.
When you use this, you're essentially creating a bridge between the backtest-kit and your chosen storage solution – like a database or a cloud service.
The waitForInit method gets things started, preparing the storage for use. readStorageData fetches all of your previously saved signals, listing them out for use. Finally, writeStorageData allows you to save new signals or update existing ones, associating them with a unique identifier.
Interface IPersistStateInstance
This interface defines how a trading strategy can save and load its state information – think of it as remembering where you left off in a trade. It's designed to be crash-safe, ensuring that even if your system unexpectedly stops, the strategy can pick up right where it left off.
If you're building a custom way to store this state (instead of using the default file-based method), you'll need to implement this interface.
Here’s a breakdown of what the methods do:
waitForInit: This method lets you set up the storage for the strategy's state. It's like telling the system, "Hey, I need to start saving data now."readStateData: This is how the strategy retrieves any previously saved state data. It’s the "load" function.writeStateData: This method saves the current state of the strategy. It’s the "save" function, and you specify when the data was last updated.dispose: This is used to clean up any resources that the storage is holding when the strategy is finished. You can think of it as releasing any locks or connections.
Interface IPersistSignalInstance
This interface lets you customize how trading signals are saved and loaded for a particular strategy, exchange, and symbol combination. Think of it as a way to replace the default file storage with your own method, like a database or cloud service.
The waitForInit method is used to set up the storage space initially. readSignalData fetches any previously saved signal information, and writeSignalData allows you to store new signal data or, if you pass null, clear out the existing data. Essentially, this interface gives you control over the persistence layer for your backtesting signals.
Interface IPersistSessionInstance
This interface helps manage how trading sessions are saved and loaded, making sure your data isn't lost even if things go wrong. Think of it as a way to customize how your backtesting framework remembers important details for each specific trading setup – like a particular strategy, exchange, and data timeframe.
If you want more control over how these session details are stored (perhaps in a database instead of a file), you can create your own adapter that follows this interface.
Here’s what the methods do:
waitForInit: Sets up the storage area for your session data when it’s needed.readSessionData: Retrieves any previously saved data for this session.writeSessionData: Saves the current data for the session, along with a timestamp.dispose: Cleans up any resources that were used.
Interface IPersistScheduleInstance
This interface lets you customize how backtest-kit saves and loads the scheduled signals for a particular trading strategy. Think of it as a way to control where and how the information about your scheduled actions (like placing an order at a specific time) is stored. Each strategy running on a specific exchange and symbol will have its own instance of this, so you can tailor the persistence for unique setups.
If you want to replace the default file storage with something else – maybe a database or an in-memory cache – you can build a class that implements these methods.
The waitForInit method is used to set up the storage when the strategy starts.
readScheduleData retrieves the saved scheduled signal data.
And writeScheduleData is responsible for saving the scheduled signal data, or clearing it if needed.
Interface IPersistRiskInstance
This interface helps manage how your trading backtest remembers active risk positions. It’s specifically for each combination of a risk name and exchange name.
Think of it as a way to customize where and how your backtest stores data about your risk exposure, potentially moving away from the default file storage.
Here’s what you can do with this interface:
waitForInit: You'll use this to set up the storage for a particular risk context when needed, providing a flag to indicate if it's a fresh start.readPositionData: This retrieves the stored data representing your active positions at a specific point in time.writePositionData: This saves the current state of your active positions to storage.
Interface IPersistRecentInstance
This interface lets you manage how recent signals are saved and loaded for a specific trading setup. Think of it as a way to keep track of the last signal generated for a particular symbol, strategy, exchange, and timeframe, ensuring that backtests and live trading use the correct information.
If you need more control over where and how these signals are stored, you can build your own adapter that implements this interface.
The waitForInit method prepares the storage space for a particular signal setup.
readRecentData retrieves the last saved signal for that setup.
writeRecentData saves the current signal, along with the time it was generated.
Interface IPersistPartialInstance
This interface helps manage how trading data, specifically partial profit and loss information, is saved and retrieved for individual trading scenarios. Think of it as a way to keep track of progress on a trade, even if the session is interrupted. It's designed to be specific to a particular combination of asset, strategy, and exchange.
Each trade's partial data is stored separately, identified by a unique signal ID.
If you want to customize where and how this data is stored (instead of using the default file-based approach), you can build your own adapter that implements this interface.
The waitForInit method prepares the storage area for the partial data.
readPartialData fetches previously saved partial data for a particular trade and time.
writePartialData saves the current partial data for a trade.
Interface IPersistNotificationInstance
This interface lets you customize how notification data is saved and loaded. Think of notifications as important messages related to your trading activity – this lets you control where and how those messages are stored. There's a separate storage system for backtesting and live trading.
The waitForInit method prepares the storage for a specific mode (backtest or live).
readNotificationData retrieves all previously saved notifications. This is used to load the history of your notifications.
Finally, writeNotificationData saves new notifications, associating each with a unique identifier. This ensures each notification has a place and can be recalled later.
Interface IPersistMemoryInstance
This interface defines how memory data is stored and retrieved for a specific context within the backtest-kit framework. Think of it as a way to manage individual pieces of information related to a particular trading setup.
It allows you to read, write, and list memory entries, and even "soft-delete" them – meaning they're removed from active use but remain on disk.
If you need to customize how memory data is handled, such as using a different storage mechanism instead of the default file system, you can create a custom adapter that implements this interface.
Here’s a quick look at what it does:
waitForInit: Sets up the storage area when needed.readMemoryData: Gets a specific memory entry by its ID.hasMemoryData: Checks if a memory entry exists.writeMemoryData: Creates or updates a memory entry.removeMemoryData: Marks a memory entry as deleted (it’s still on disk, just not used).listMemoryData: Provides a list of all currently active memory entries.dispose: Cleans up any resources used by the storage.
Interface IPersistMeasureInstance
This interface defines how to store and retrieve cached data for individual buckets within the backtest-kit framework. Think of it as a way to persist data for faster access.
The system allows for a "soft delete" feature, meaning that removed data isn't truly erased from disk; instead, it’s marked as removed and filtered out during reads.
If you want to customize how data is stored – perhaps using a database instead of a file – you can implement this interface.
Here's a quick rundown of what's involved:
waitForInit: Prepares the storage area for a particular bucket.readMeasureData: Retrieves a cached data entry given its key.writeMeasureData: Saves a data entry to the cache, including a timestamp.removeMeasureData: Marks a data entry as deleted (soft delete).listMeasureData: Provides a way to get a list of all the keys for entries that haven’t been marked for deletion.
Interface IPersistLogInstance
This interface defines how to manage a global, persistent store for log entries within the backtest-kit framework. Think of it as a central place to keep track of all your logs, accessible across different parts of your trading system.
It's designed for situations where you want to customize how logs are stored – perhaps you want to use a database instead of a file.
The waitForInit method allows you to ensure the log storage is ready before you start writing to it.
readLogData lets you retrieve all the logged data that has been previously saved.
Finally, writeLogData is used to add new log entries, ensuring that you don't accidentally overwrite existing ones – the log should always grow sequentially.
Interface IPersistIntervalInstance
This interface lets you customize how the backtest-kit framework remembers which time intervals have already been processed for a specific trading setup. Think of it as a way to keep track of whether a particular "bucket" of time has already had its signals fired.
It's particularly useful when you need to store this information in a custom location, not just relying on the default file system.
The waitForInit method prepares the storage for each bucket. readIntervalData retrieves existing marker data. You’ll use writeIntervalData to record when an interval has been processed. If you need to rerun a process for a specific interval, removeIntervalData lets you essentially "forget" about it, allowing the system to fire the signal again. Finally, listIntervalData gives you a way to see which intervals are still marked as needing processing.
Interface IPersistDictionaryInstance
This interface defines how to manage and save dictionary data specifically tied to a particular signal and a named dictionary. It's used to ensure that dictionaries are safely stored even if the application crashes.
If you want to customize how these dictionaries are saved (maybe using a database instead of a file), you can create your own adapter that implements this interface.
Here's what the methods do:
waitForInit: Sets up the storage for your dictionary.readDictionaryData: Retrieves any previously saved snapshot of the dictionary.writeDictionaryData: Saves a snapshot of the current dictionary along with a timestamp.dispose: Cleans up any resources that your dictionary storage uses.
Interface IPersistCandleInstance
This interface defines how your application can manage and store historical candle data for a specific trading symbol, timeframe, and exchange. Think of it as a way to keep a local record of past prices, so you don't have to constantly pull them from the data source.
The waitForInit method allows you to set up the storage area for the data.
readCandlesData lets you retrieve a set of candles within a specific time range. Crucially, if any candle is missing from the cache, it will return null, signaling that the data needs to be fetched again.
writeCandlesData is used to save the retrieved candles to the local cache. Implementations may choose to ignore candles that are not fully completed or to avoid overwriting existing data.
This gives you flexibility in how your backtesting framework handles the storage of candle data, potentially using alternatives to the default file system.
Interface IPersistBreakevenInstance
This interface defines how to manage and save breakeven information for specific trading setups. Think of it as a way to remember crucial data points related to how much a trade needs to move in your favor before it becomes profitable.
Each set of data is tied to a unique combination of symbol (the asset being traded), strategy name, and exchange.
You can use this interface to create your own custom ways of storing this breakeven data – perhaps in a database, or a different file format – instead of relying on the default file-based system.
The waitForInit method allows you to prepare the storage area when you start. readBreakevenData lets you load previously saved breakeven data for a particular trade, and writeBreakevenData is used to save new or updated breakeven information.
Interface IPersistBase
This interface helps you build custom ways to save and load your trading data, like using a different kind of database.
It outlines the basic functions needed: initializing the data storage, retrieving a specific data item, checking if a data item exists, saving a data item, and listing all the available data items.
The waitForInit method handles setting up the storage and making sure everything's ready, while readValue and hasValue let you get data. writeValue is for saving data, ensuring changes are saved safely, and keys provides a way to see all the data identifiers, sorted in a predictable order, which is helpful for checking everything is in place.
Interface IPartialProfitCommitRow
This represents a single instruction to take a partial profit on a trade. Think of it as a record of one specific action – closing a portion of your position – that's been added to a queue.
It includes the type of action, which is always "partial-profit", along with the percentage of the position that was closed. Finally, it also records the price at which this partial profit take was executed.
Interface IPartialLossCommitRow
This represents a record of a partial loss order that's been queued for execution.
It tells you what action was taken ("partial-loss"), how much of the position was closed (specified by percentToClose), and the price at which that partial loss was carried out (currentPrice). Essentially, it's a snapshot of a partial closure of a position.
Interface IPartialData
This data structure helps save and load key information about a trading signal, even if you don't need everything. It's designed to be easily stored and retrieved, especially when dealing with larger amounts of data.
Think of it as a snapshot of the important progress of a signal – specifically, where it's hit its profit and loss targets.
The profitLevels and lossLevels properties store these levels as simple lists, which are easy to save and load. This avoids some complexities that can arise when dealing with more elaborate data structures.
Interface IPartial
The IPartial interface is responsible for keeping track of how much profit or loss a trading signal has generated. It’s used by components like ClientPartial and PartialConnectionService.
When a signal is generating profit, the profit method calculates the current profit level (10%, 20%, 30%, and so on), and sends out notifications only when a new level is reached. Similarly, the loss method does the same for losses.
The clear method is used when a signal has finished trading, whether that's because it hit a target profit, a stop-loss, or simply expired. It cleans up the signal's information, removes it from active memory, and saves the changes.
Interface IParseArgsResult
The IParseArgsResult object holds the information gathered when you process command-line arguments. It essentially combines your initial input parameters with flags that determine the trading environment you'll be using. Specifically, it tells you whether you're running a backtest (simulating historical trades), paper trading (simulated trading with live market data), or live trading (actual trading with real funds). This lets your application adapt its behavior based on how you want to operate.
Interface IParseArgsParams
This interface outlines the essential information needed to run a trading strategy. It specifies the trading pair you're interested in, like "BTCUSDT," the name of the strategy you want to use, and the exchange where that strategy will trade, such as Binance or Bybit. Finally, it defines the timeframe for the historical data the strategy will analyze, for example, hourly candles or 15-minute intervals. Essentially, it's a set of defaults that tells the system what to trade, where to trade it, and how detailed the historical data should be.
Interface IOrderBookData
The IOrderBookData interface holds the information about an order book, which essentially represents the current state of buy and sell orders for a particular trading pair.
It includes the symbol which identifies the trading pair, like 'BTCUSDT'.
You'll also find arrays of bids and asks. The bids array contains details about orders to buy a specific asset, and the asks array contains details about orders to sell. Each element in these arrays represents a single order with its price and quantity.
Interface INotificationUtils
This interface defines how different systems can receive updates and notifications from the backtest kit. Think of it as a central point for delivering information about what's happening during a trading simulation.
It includes methods for handling various events like new signals being generated (when trades are opened or closed), profit or loss adjustments, strategy modifications, and order confirmations or rejections.
You'll also find methods to deal with different kinds of errors and to get a full history of all notifications that have been sent. Finally, there’s a way to clean up and clear that notification history when it's no longer needed.
Interface INotificationTarget
This interface helps you fine-tune what notifications you want to receive from the backtesting or live trading system. Instead of getting every possible update, you can specifically subscribe to the events that are most relevant to your needs. Think of it as a filter – you tell the system exactly what kinds of information you want to see.
Here's a breakdown of the different notification types you can enable:
- Signals: Updates about the lifecycle of trading signals, like when they're created, scheduled, closed, or canceled.
- Partial Profit/Loss: Notifications when the price reaches pre-defined partial profit or loss levels.
- Breakeven: Alerts when the price hits your breakeven point.
- Strategy Commitments: Confirmation that the strategy has taken actions like partial profits, losses, or cancels.
- Order Sync: Events related to order confirmations and placement when trading live.
- Order Checks: Notifications for checking if an order is still open with an exchange - used when trading live.
- Order Fills: Confirmation of completed order executions - only when trading live and confirmed by the exchange.
- Order Rejects: Alerts about rejected orders from the broker - live trading only.
- Order Continues: Notifications confirming an order remains open after a check - live trading only.
- Order Stops: Signals that an order check has reached a terminal state, like being deleted or exhausted – live trading only.
- Risk: Notifications when the risk manager blocks a new signal.
- Info: Manual or strategy-triggered messages associated with a signal.
- Pause: Alerts when the strategy enters or exits a paused state.
- Common Errors: Reports of non-critical errors that are logged but don't stop the process.
- Critical Errors: Notifications of serious, unrecoverable errors that will end the session.
- Validation Errors: Alerts if there are issues with your strategy’s configuration or input data.
By carefully choosing which properties to enable, you can streamline your monitoring and focus on the most important events occurring in your trading system.
Interface IMethodContext
The IMethodContext helps your backtesting framework keep track of which specific configurations it's working with. It essentially holds the names of the strategy, exchange, and frame being used for a particular test. Think of it as a little package of information passed around to make sure the right components are loaded and used—like telling the system "Okay, use the 'Binance' exchange, the 'MyStrategy' strategy, and the 'HistoricalData' frame for this backtest." The frame name being empty signifies a live trading scenario.
Interface IMemoryInstance
The IMemoryInstance interface outlines how different memory storage systems – whether they're temporary, saved permanently, or just for testing – should behave.
It provides methods for interacting with the memory. You can use waitForInit to get the memory ready for use. writeMemory allows you to save information to memory, specifying what you're storing, a description, and when it occurred.
Searching for information is easy with searchMemory, which uses a powerful text search to find relevant entries, while listMemory lets you view all entries up to a certain point in time. If you need to delete something, removeMemory handles that.
Need to retrieve a specific piece of information? readMemory gets a single entry, and if it's not available at the time you request it, it won’t be found. Finally, dispose is used to clean up any resources the memory system is using when you're finished with it.
Interface IMarkdownTarget
This interface lets you fine-tune which reports are generated by the backtest kit. Think of it as a way to control the level of detail you want in your trading analysis.
You can choose to activate reports covering everything from strategy signals and risk rejections to performance metrics and even the lifecycle of signals. It’s a way to zero in on specific areas you want to investigate, like how your strategy performs or potential bottlenecks.
Here's a breakdown of what each setting does:
- strategy: Shows when your strategy generated buy or sell signals.
- risk: Highlights situations where the strategy was blocked by risk controls.
- breakeven: Tracks when your stop loss moves to match your entry price.
- partial: Records information about partial profit or loss events.
- heat: Provides a portfolio heatmap that visualizes your trading activity across different assets.
- walker: Helps you compare and optimize different strategies.
- performance: Gives you metrics on how your system is performing and identifies any slowdowns.
- schedule: Tracks signals that are waiting for a specific trigger.
- live: Captures all trading events as they happen in a live environment.
- backtest: Generates a comprehensive report of your backtest results, including trade history.
- sync: Provides insights into how signals are created and closed.
- highest_profit: Monitors the highest profit achieved.
- max_drawdown: Tracks the maximum drawdown experienced.
Interface IMarkdownDumpOptions
This interface defines the options used when generating markdown documentation within the backtest-kit framework. It essentially provides the context needed to identify and organize the output. Think of it as a blueprint for where and what information should be included in the generated documentation.
The options include details like the directory path, specific file names, and the identifiers for the trading pair, strategy, exchange, timeframe, and even a unique signal ID. This allows for very targeted documentation generation, ensuring that the right information is readily available and organized logically.
Interface IMCPTextMessage
This represents a simple text message used within the Model Context Protocol (MCP). Each message has a unique ID, allowing the system to keep track of it and avoid sending the same message twice. The type field clearly indicates it's a text message, and the core of the message is the text property, which contains the actual human-readable content.
Interface IMCPSignalNotifyCommand
This command is used to send out informational notifications related to active trades. It specifically focuses on positions that are currently open and enabled for live trading. The system uses the symbol, like "BTCUSDT," to identify the particular trade associated with the notification.
Each notification also includes the name of the MCP (Model Context Protocol) schema responsible for sending the message and a short, descriptive note to provide context for the notification. Think of it as a way to communicate important updates about your trading activity.
Interface IMCPSchema
This defines how your strategies connect to the backtest environment and how agents interact with them. Think of it as a configuration that links a name (the MCP name) to a specific strategy and sets up rules for how trades are executed and information is shared.
It's essentially a way to group strategies together under a common control point. If you have multiple strategies, this helps avoid confusion and ensures clear communication.
You can specify which strategy the configuration applies to, or if none are explicitly named, it uses the single registered one. If multiple strategies exist without specification, you must name them.
The configuration also controls important aspects of trading like the cost of entering a position, the leverage used, and the permissions granted to external agents. You can adjust these parameters to customize how the strategy operates.
You can customize how the portfolio status is communicated to the agent, or just omit this to use the default system. Finally, you have the option to add callbacks to react to lifecycle events if needed.
Interface IMCPPositionOpenCommand
This interface defines the data needed to request opening a position in a trading system. It's used to tell the system to start a trade, setting up a specific type of order with preset take profit and stop-loss levels.
You'll specify the symbol you want to trade, like "BTCUSDT".
Then you tell the system whether you want to buy (long) or sell (short).
The mcpName identifies which strategy or system is making the request, and a helpful note field lets you add a description for why the trade is being initiated. Essentially, it's a request to the system to create a new trade with specific parameters and a note about why.
Interface IMCPPositionCloseCommand
This interface defines the data needed to tell the system to close an existing trading position.
It's used when a strategy wants to finalize a trade and remove it from the pending state.
You’ll specify the trading pair – like "BTCUSDT" – to indicate which position to close.
You also need to provide the name of the specific trading strategy (MCP) that’s initiating the close.
Finally, you can add a note to explain why the position is being closed, which helps with tracking and analysis.
Interface IMCPImageMessage
This describes a special message used within the system to transmit image data, like a chart or graph. Each image message has a unique ID so the system knows it's being sent and doesn't get duplicates.
The message is clearly identified as an "image" type for organization.
It also includes the image's MIME type, such as "image/png," to tell the receiving system how to interpret the image data. Finally, the message contains the actual image data, which is encoded in a base64 format.
Interface IMCPContext
The IMCPContext provides a snapshot of your portfolio's holdings for each symbol your strategy is trading. Think of it as a regularly updated view of what your strategy owns. Each time your strategy's logic is executed, it receives this context, giving it the information it needs to make informed trading decisions. This context is specific to each live instance of your trading strategy.
Interface IMCPCallbacks
This section describes callback functions that let you observe what actions a backtest kit model takes during its operation. Think of them as ways to peek behind the scenes and see the raw data being used. They're designed to help you understand the process without interfering with the actual backtest.
If you don’t provide a callback function, it simply won't be executed. If a callback function encounters an error, the error will be logged but won't stop the backtest from continuing.
Here's a breakdown of the available callbacks:
- onStatus: This fires when the system retrieves the status of your portfolio. You'll get the snapshot of the portfolio and any messages generated.
- onPositionOpen: This is triggered when a new position is opened successfully. You’ll receive details about the signal used, including things like take profit and stop-loss levels, the cost of the position, and any notes.
- onPositionClose: This callback happens after a closing of a position is confirmed. It provides the ID of the original signal that triggered the closure.
- onAverageBuy: This is fired when a DCA (Dollar-Cost Averaging) entry is accepted. You’ll receive the ID of the pending signal that the entry was averaged into.
- onSignalNotify: This gets called when a notification is sent for a signal. You'll receive the ID of the signal that the notification is linked to.
Interface IMCPAverageBuyCommand
This command is used to add a small purchase order, often referred to as a "DCA" (Dollar-Cost Averaging) entry, to a trading position.
It's specifically for use with the Model Context Protocol (MCP) system, which helps manage and control trading strategies.
Essentially, it adds a buy order at the current price for a particular trading pair, like BTCUSDT. The system knows which trading strategy is associated with this order based on the name of the MCP. The cost of this purchase is determined by the settings within the strategy itself.
Interface ILogger
The ILogger interface defines how different parts of the backtest-kit framework communicate about what's happening. It allows components like agents and storage to record messages about their activities.
You can use the log method for general recordings of important events.
The debug method is for detailed information that helps with development and troubleshooting.
info lets you track successful operations and key updates.
Finally, warn flags potential problems that need a closer look.
These logging methods help with understanding what’s going on inside the system, making it easier to debug, monitor, and audit.
Interface ILogEntry
This interface represents a single entry in the backtest kit's log history. Each log entry has a unique identifier, a type indicating its severity (like "log," "debug," or "warn"), and a timestamp for tracking and potential log rotation. It also includes a createdAt timestamp which is helpful for displaying the log entry in a user-friendly format.
To help understand where a log came from, the methodContext and executionContext properties provide extra information about the environment and state at the time it was generated. The topic specifies what part of the process generated the log, and args allows you to pass along additional data that might be useful for debugging.
Interface ILog
The ILog interface lets you keep a record of what's happening during your backtesting or trading simulations, offering more than just basic logging. It builds on the standard logging levels and integrates with agent logging, providing a richer picture of your system’s activity. You can retrieve a complete list of log entries to review the full sequence of events that occurred. This is particularly helpful for debugging and understanding how your strategies perform.
Interface IHeatmapRow
This interface represents a single row within a portfolio heatmap, giving you a detailed snapshot of a specific trading symbol's performance. It contains a wealth of information, from basic stats like the total profit/loss and number of trades, to more advanced metrics assessing risk and return.
You'll find measures like the Sharpe Ratio and Sortino Ratio, which help evaluate your risk-adjusted returns. Drawdown metrics show the potential downside, while win rate, average win/loss, and expectancy offer insights into trade profitability.
Beyond that, you can analyze trade durations, observe consecutive winning/losing streaks, and even understand buyer/seller pressure on the market. Finally, trend analysis, including strength and confidence, helps to assess the direction of the market. All these properties work together to paint a comprehensive picture of how a particular symbol has performed within your overall trading strategy.
Interface IFrameSchema
The IFrameSchema lets you define specific time periods and intervals for your backtesting simulations. Think of it as a blueprint for creating a slice of historical data to test your trading strategies against. Each schema has a unique name to identify it, and you can add notes for yourself or others to understand its purpose.
You specify the start and end dates for the backtest period, as well as the interval (like 1 minute, 1 hour, or daily) at which data points will be generated. If you don’t provide an interval, it defaults to one minute.
Finally, you can include optional callback functions to execute at specific points in the frame's lifecycle, allowing for custom data handling or analysis.
Interface IFrameParams
The IFrameParams object helps define how a frame, a fundamental building block in backtest-kit, operates. It essentially bundles together key settings for each frame.
Think of it as a configuration object given to the ClientFrame when it's created.
It includes a logger to help you track what's happening inside the frame during the backtest – useful for debugging.
The interval property specifies a unique name for that particular frame, making it easy to identify and manage them.
Interface IFrameCallbacks
The IFrameCallbacks interface lets you hook into key moments in the backtest process, specifically related to how timeframes are created. Think of it as a way to observe and potentially react to the sequence of dates used for your backtest.
The most important piece here is onTimeframe. This function gets called immediately after the framework builds the list of timeframes it will use. It provides you with the generated timeframe array, the start and end dates of the backtest, and the interval used to create those timeframes. You can use this to double-check that the timeframes are what you expect, or simply to record information about them.
Interface IFrame
The IFrame interface is a key part of how backtest-kit manages and organizes time data for your trading simulations. Think of it as the foundation for creating timelines.
Its main job is to generate a list of specific dates and times. These timestamps are carefully calculated based on the interval you've set for your backtest, ensuring consistent spacing between each data point.
The getTimeframe function takes a symbol (like a stock ticker) and a name for the timeframe (e.g., "daily", "hourly") and returns a promise containing an array of these timestamps. This array is then used to guide the backtest process, ensuring that all calculations and evaluations happen at the correct moments in time.
Interface IExecutionContext
The Execution Context provides the essential information your trading strategies and exchange interactions need to function correctly. Think of it as a package of data that's passed around to give your code the current time and which environment it’s running in – whether it’s a backtest or a live trading session. It tells your code what symbol is being traded and the current timestamp, so you can make decisions based on the specific moment in time. This context is automatically provided by the ExecutionContextService, so you don't usually need to create it yourself.
It includes:
- The
symbol, which is the trading pair like BTCUSDT. - The
whenvalue, representing the current timestamp. - A
backtestflag that's true if you're simulating trades and false if you're trading live.
Interface IExchangeSchema
The IExchangeSchema defines how backtest-kit interacts with a particular exchange or data source. Think of it as a blueprint for connecting to a crypto exchange and pulling in the data needed for backtesting.
It requires a unique exchangeName to identify the exchange and can include a helpful note for documentation.
The most important part is getCandles, which tells backtest-kit how to retrieve historical price data (candles) – you’ll need to provide the API calls or database queries for fetching this information.
You can also define formatQuantity and formatPrice to ensure that the quantities and prices are represented correctly, according to the specific rules of that exchange. If you don't provide these, it will use default formatting.
Optional functions like getOrderBook and getAggregatedTrades allow you to pull in order book data and aggregated trades for even more sophisticated backtesting, but if omitted, they will result in an error if called.
Finally, callbacks let you define functions that are triggered at specific points, like when new candle data arrives.
Interface IExchangeParams
This interface defines the essential configuration needed to connect to and interact with an exchange within the backtest-kit framework. Think of it as the set of tools your backtesting system needs to talk to a real or simulated exchange.
It requires several functions to be implemented, including how to retrieve historical price data (candles), how to format order quantities and prices to match the exchange's rules, and how to access order book and trade information.
The logger property lets you add debug messages for troubleshooting, and execution provides access to important contextual information like the trading symbol, timestamp, and whether the test is a backtest or live execution. These methods are core to simulating realistic trading conditions.
Interface IExchangeCallbacks
This section defines callbacks you can use to respond to events coming from a data source, like an exchange. Specifically, onCandleData lets you react when new candlestick data becomes available. You'll receive details like the symbol, time interval, starting date, the number of data points received, and the actual candle data itself. This allows you to process and display this data as it arrives.
Interface IExchange
The IExchange interface defines how your backtesting environment interacts with an exchange. It provides methods for retrieving historical and future candle data, essential for analyzing price action and simulating trades.
You can request historical candles using getCandles, or look ahead to future candles with getNextCandles – crucial for simulating real-time scenarios during backtesting. The framework also handles the specifics of formatting trade quantities and prices to match the exchange's requirements with formatQuantity and formatPrice.
Calculating the VWAP (Volume Weighted Average Price) is made easy with getAveragePrice, which uses the typical price (high + low + close / 3) and volume over the last five one-minute intervals. If you need the most recent close price for a particular interval, getClosePrice delivers that.
Beyond price data, you can retrieve order book information using getOrderBook and aggregated trade history with getAggregatedTrades. The getRawCandles method is the most flexible, letting you specify start and end dates along with a limit, or just a limit to retrieve candles relative to the current execution time. The framework rigorously prevents look-ahead bias by respecting the execution context when fetching data.
Interface IEntity
This interface serves as the foundation for all objects that are saved and retrieved from storage within the backtest-kit framework. Think of it as a common starting point; anything you want to store persistently, like trades or account information, will likely implement this interface. It ensures that all persisted objects have a consistent structure and behavior.
Interface IDumpInstance
This interface defines how components can save data during a backtest run. Think of it as a standardized way to log details about what's happening, allowing for comprehensive analysis later.
Each dump instance is tied to a specific signal and bucket, ensuring data is organized correctly. When saving information, you only need to provide the actual data and a unique identifier (dumpId).
The interface offers several methods for different types of data:
dumpAgentAnswer: Records the entire conversation history of an agent.dumpRecord: Stores simple key-value data.dumpTable: Saves data formatted as a table, automatically using all column headers.dumpText: Persists plain text or Markdown content.dumpError: Records error messages.dumpJson: Stores complex objects as formatted JSON.dumpMCPStatus: Captures the status of the Model Context Protocol.
Finally, dispose provides a way to clean up and release any resources used by the dump instance when it's no longer needed.
Interface IDumpContext
The IDumpContext helps track where data is coming from when saving information during a trading simulation. Think of it as a set of labels that identify each piece of data – it tells you which trade it relates to (signalId), which strategy or agent generated it (bucketName), and whether it's part of a backtest or live trading (backtest). Each dump gets a unique identifier (dumpId), and you can give it a descriptive label (description) to easily understand what the data represents. This context is automatically provided when saving data, so you don't need to create it yourself.
Interface IDictionaryInstance
The IDictionaryInstance interface defines how a dictionary-like storage should behave within the backtest framework. Think of it as a special kind of map for holding data related to individual signals or trading opportunities.
This dictionary is designed for storing temporary information needed by your trading strategy, like annotations or flags, and ensures this data is tied to the specific lifespan of a signal.
A crucial feature is "look-ahead bias protection." When reading data, the system only considers entries that occurred before the current point in time, preventing the strategy from unfairly using future information. If you try to access data that's "too far in the future," it won't be visible.
Writing data is also controlled by time; older timestamps will overwrite any existing data, which is useful if you restart a backtest and want to clear any previous entries.
The dictionary provides standard methods like get, set, has, delete, clear, and functions to retrieve keys, values, and entries, all while respecting the time-based look-ahead rule. There's also a dispose method for cleaning up resources when the dictionary is no longer needed.
Interface ICommitRowBase
This interface, ICommitRowBase, helps manage how information about trades is shared within the trading system. Think of it as a way to hold onto details about a trade—like which asset was involved—until the system is fully ready to process it. It’s a foundational piece for delaying those updates and ensuring everything happens in the right order. The symbol property tells you which trading pair was involved (e.g., "BTC-USDT"), and the backtest property indicates whether the trade occurred during a simulated backtest rather than live trading.
Interface ICheckCandlesParams
This interface defines the information needed to check if your historical candle data is available. It’s used to quickly verify if a specific trading symbol, exchange, and timeframe has the candle data you expect without needing to look through all your files. You’ll provide details like the trading pair (like BTCUSDT), the exchange it’s from, the time interval of the candles (like 1-minute or 4-hour), and the start and end dates you want to check. This helps ensure your backtesting system has all the necessary data before it begins.
Interface ICandleData
This interface describes a single candlestick, the kind of data you'd typically see in a trading chart. Each candlestick represents a specific time period and holds information about the price action during that time. You’ll find the exact moment the candle began as a timestamp, along with the opening price, the highest and lowest prices reached, the closing price, and the total trading volume. This structure provides a complete snapshot of price and volume activity for a given interval.
Interface ICacheCandlesParams
This interface defines the settings you can use when setting up how your backtest kit retrieves historical data. It lets you customize the process of first checking if data exists and then pre-loading it for faster performance. You can provide functions to be called at specific points: just before the initial validation check and just before the warm-up process begins if validation fails. These functions will give you information about the symbol, timeframe, and date range involved.
Interface IBrokerOrderVerdictTransient
This object represents a temporary setback encountered while trying to place or manage an order. It's a signal from the backtest-kit framework indicating that something briefly prevented an order from going through – perhaps a network issue or a temporary problem with the exchange.
Don't worry about creating this object directly; it’s automatically generated by the framework based on signals from your trading logic. If a temporary problem occurs, the framework will handle retries automatically, giving the order a few chances to succeed before giving up.
The reason field confirms that the issue is a transient, temporary problem, and the error field provides details about the specific failure that caused it.
Interface IBrokerOrderVerdictRejected
When an order can't be fulfilled due to a business-level issue, this signal is used to communicate that rejection. It's a final decision – the system won't try to resubmit the order.
Think of it as the trading platform saying, "This order simply cannot happen."
This signal isn't created by the listeners; instead, listeners use specific return values or errors to indicate whether an order is confirmed, a temporary problem, or a permanent rejection.
The reason property clearly states that the rejection is terminal, meaning it's unlikely to be resolved through retries. The error property holds the original error that caused the rejection, giving more detail about why the order was denied.
Interface IBrokerOrderVerdictDeleted
This describes what happens when an order is unexpectedly removed during the trading process. It's a signal from the system letting you know that an order, which was previously considered valid, is now gone – think of it like the exchange or platform canceled it.
You, as a developer integrating with the framework, don’t directly create this signal; instead, your code reacts to potential order events and communicates confirmation, transient issues, or rejections.
When an order is deleted, the framework delivers this IBrokerOrderVerdictDeleted to inform the system that the order is considered gone. Specifically, this means checks immediately stop, bypassing certain safety measures. The error property will contain the reason for the deletion, such as the user canceling the order on the exchange.
Interface IBrokerOrderVerdictConfirmed
This object represents a final decision made by the backtest-kit system about an order. It's how the system communicates whether an order can proceed or not. You, as a developer building adapters, don't create these verdicts directly. Instead, you signal your decision by returning a value (success/failure) or throwing an error to indicate what should happen next.
The reason property, when set to "confirmed", means the order is allowed to go through or that a previously checked order remains valid. This signals the framework to proceed with the order execution or continue tracking it.
Interface IBrokerOrderVerdictBase
The IBrokerOrderVerdictBase is a foundational structure used within the backtest-kit framework when the system needs to make a decision about an order – whether it can proceed or not. Think of it as the common base for different reasons why an order might be rejected or accepted. It's designed to consistently handle these order evaluations regardless of the specific logic causing the verdict. The __type__ property is a special marker that identifies this as a base verdict, crucial for the framework to understand what kind of decision is being communicated.
Interface IBroker
This interface, IBroker, acts as the bridge between your trading framework and a real-world brokerage or exchange. It allows the framework to execute orders and interact with the exchange. All the methods within this interface are executed before any internal state changes happen within the trading framework, ensuring a consistent, transactional process. Importantly, backtesting mode completely bypasses these calls – they are exclusive to live trading.
Here's a breakdown of what each method does:
waitForInit: This is the initial setup. It’s crucial for connecting to your exchange, loading credentials, and most importantly, cleaning up any "orphan" orders or positions that might have been left over from previous sessions. This prevents your trading logic from operating on top of stale or unmanaged positions. It's triggered before the very first trade signal and should be used sparingly due to a timing quirk – attempting to create a new position during this process can cause issues.
onOrderCloseCommit: This is for closing existing positions (take-profit, stop-loss, or manual closures). It's a vital "gate" where you place the actual close order on the exchange. Throwing an error here indicates a temporary issue (like a network problem), retrying the closure; a more serious error immediately forces a closure and halts the trading engine.
onOrderOpenCommit: Responsible for opening new positions. Like onOrderCloseCommit, it's a crucial "gate" to place the actual order on the exchange, tagging it with a unique ID. Errors here result in either retries or immediate rejection, depending on the error type.
onOrderActiveCheck: This continuously monitors an open position. It periodically checks if the order still exists on the exchange. If the order is missing (e.g., cancelled or filled without notification), it will automatically close the position. Handles temporary connection issues gracefully by retrying.
onOrderScheduleCheck: Similar to onOrderActiveCheck, but for resting (limit) orders placed for entry signals. Monitors the order to see if it’s been filled or cancelled.
onSignalActivePing: This method is called per tick of a live position. It is not a gate and doesn't directly control position closure. Instead, it allows you to react to real-time events, such as a gap through a stop-loss or a take-profit being filled before the framework detected it, and adjust the position accordingly.
onSignalSchedulePing: A counterpart to onSignalActivePing, but for resting/limit orders waiting for activation. Used to react to real-time events affecting the resting order.
onSignalIdlePing: Called when there are no open or scheduled signals. Useful for periodic checks or housekeeping tasks.
onSignalScheduleOpen: Called when a new resting (limit) order is created. Here you place the order on the exchange.
onSignalScheduleCancelled: Called when a scheduled order is cancelled. Allows for cleanup of the corresponding order on the exchange.
onSignalPendingOpen: This signifies the opening of a position and allows for placing confirmation and protective orders.
onSignalPendingClose: This method is called after a position has been closed. Allows for a final clean-up including final PnL recording.
onPartialProfitCommit, onPartialLossCommit, onTrailingStopCommit, onTrailingTakeCommit, onBreakevenCommit, and onAverageBuyCommit: These handle specific types of trading actions, each providing a dedicated event hook for confirmation or cleanup actions after the commitment of these trading strategies.
Interface IBreakevenData
This data structure holds simple information about whether a breakeven point has been achieved for a particular trading signal. It's designed to be easily saved and loaded, like when storing data for later use or sharing. Think of it as a quick "yes/no" indicator: has the breakeven been met? This is a simplified version of a more complex breakeven state, specifically made for saving as a JSON file. It's used within the framework to track this key piece of information for each trading signal.
Interface IBreakevenCommitRow
This object represents a change request related to breakeven points in your trading strategy. Think of it as a signal that the system needs to adjust something concerning when a trade breaks even.
The action property simply tells us the type of action being requested – in this case, it's specifically a "breakeven" adjustment.
The currentPrice tells you the price at which the breakeven point is being recalculated or applied. It's the price that's important when deciding where to move those break-even markers.
Interface IBreakeven
The IBreakeven interface helps track when a trading signal's stop-loss should be adjusted to the entry price, essentially breaking even on the trade.
It monitors the price movement and will trigger an event when the price has moved sufficiently to cover any transaction costs associated with the trade.
The check method determines if this breakeven point has been reached, and if so, records it and notifies any connected listeners. The clear method resets the breakeven state when a trade closes, removing the record and cleaning up associated data. This functionality is used by the trading strategy to manage risk and ensure profitability.
Interface IBidData
The IBidData interface represents a single bid or ask price and its associated quantity within an order book. It essentially describes a specific level of interest – how much of an asset people are willing to buy (bid) or sell (ask) at a particular price.
Each IBidData object contains two key pieces of information: the price at which the bid or ask is placed, and the quantity of the asset available at that price. Both the price and quantity are represented as strings.
Interface IAverageBuyCommitRow
This interface represents a single step in a queued average-buy (DCA) strategy. Think of it as a record of one buy order placed as part of a larger DCA plan.
Each record includes the price at which the order was filled, the cost in US dollars for that particular buy, and the total number of buy orders currently accumulated within the strategy. It helps track how the DCA is progressing over time.
Interface IAggregatedTradeData
IAggregatedTradeData holds information about a single trade that took place. Think of it as a record of one transaction. It stores key details like the price at which the trade happened, the quantity of assets exchanged, and the exact time of the trade. Importantly, it also tells you if the buyer was acting as a market maker, which helps understand the direction of the trade – whether it was initiated by someone providing liquidity. Each trade record has a unique ID for easy tracking.
Interface IAgentLogger
This interface, IAgentLogger, provides a dedicated channel for logging information specifically about the actions of your AI agent. Think of it as a way to track what your model is doing - its reasoning, the tools it's using, and the results it generates.
It’s separate from the framework's internal logging because that handles system health and debugging. This agent logging focuses on the user's perspective, allowing you to review the agent's activity as part of a historical record.
The agent method is your primary tool; use it to record these agent-related events with a descriptive topic and any relevant details. This keeps your agent's actions distinct and understandable within the overall log.
Interface IActivityEntry
An IActivityEntry represents a single instance of a trading process, whether it's a backtest or a live trade. Think of it as a record keeping track of what's currently running.
It’s created when a trading process begins and automatically removed when it finishes, successfully or with an error.
This record helps the system recognize and manage multiple trading processes running simultaneously, preventing conflicts and ensuring things run smoothly.
It contains details like the trading pair involved (e.g., "BTCUSDT"), identifying information about the strategy and exchange used, and whether it’s a backtest or live execution.
Interface IActivateScheduledCommitRow
This interface represents a queued request to activate a scheduled commit within the backtest-kit framework. Think of it as a message saying, "Hey, it's time to trigger this pre-planned action!"
It includes a clear identifier, action, specifying the task at hand, which is activating a scheduled commit. You'll also find signalId, the unique identifier of the signal that's being activated. Finally, activateId is available to provide an extra way to identify the activation event, if needed.
Interface IActionStrategy
The IActionStrategy interface gives your action handlers a way to peek at the current signal situation – whether there's an active signal or one that's waiting to happen. Think of it as a read-only window into what the strategy is planning.
This lets you control certain actions, like setting breakeven or profit targets, so they only run when appropriate.
It provides two key methods:
-
hasPendingSignal: This method tells you if there's a currently open position for a given symbol. -
hasScheduledSignal: This method tells you if a signal is queued and waiting to be triggered for a given symbol.
Interface IActionSchema
The IActionSchema allows you to extend your trading strategy's capabilities by adding custom logic that runs alongside the main execution. Think of it as a way to hook into the strategy at specific points to do things like log events, send notifications, or integrate with external systems like Redux for state management.
You register these actions using addActionSchema(), providing a name, an optional description, and a handler function.
The handler function is essentially a blueprint for an object that will be created each time the strategy runs in a new "frame" (a slice of time). It receives all the events that occur during that frame.
You can also specify optional callbacks to control when your action runs – for example, before or after the strategy’s main execution. This gives you fine-grained control over how your action interacts with the trading process, enabling things like custom business logic triggers or metrics collection.
Interface IActionParams
The IActionParams object holds all the important information your actions need to function correctly. Think of it as a package of context delivered to each action when it’s executed.
It includes a logger for keeping track of what's happening, so you can debug and monitor your actions. You'll also find details about the strategy – its name, the exchange it's connected to, and the timeframe it’s operating on.
Crucially, it tells you if you’re running a backtest or live trading. Finally, strategy provides access to real-time data like the current signal and any existing positions, allowing your actions to react to the changing market conditions.
Interface IActionCallbacks
This API reference details the lifecycle callbacks available when using the backtest-kit trading framework. Think of these callbacks as hooks that let you customize what happens at different stages of a trading action.
The onInit callback runs when an action handler is set up – good for things like connecting to a database or initializing services. onDispose is its counterpart, used for cleanup like closing connections or saving data.
For signal events, there are separate callbacks: onSignal for all modes, onSignalLive for live trading, and onSignalBacktest for backtesting. These fire whenever the strategy is evaluated, allowing you to react to new signals.
Several specialized callbacks handle specific events: onBreakevenAvailable for breakeven triggers, onPartialProfitAvailable and onPartialLossAvailable for profit/loss levels, onPingScheduled for monitoring scheduled signals, and onScheduleEvent for scheduled signal lifecycle events.
The onPendingEvent callback is for tracking signal lifecycle (open/close), while onPingActive monitors active positions and onPingIdle runs when no signals are active. onRiskRejection is triggered when a signal is rejected by the risk management system.
onOrderSync is a critical callback used to approve or reject order openings and closings – this is an exception-based gate, and unhandled exceptions will propagate. Finally, onOrderCheck runs during live trading to verify order status. Backtest short-circuits most of these for performance.
These callbacks provide manual wiring points for events – essentially, ways to directly control the exchange interactions based on specific actions and signals within the strategy. They are powerful tools for fine-grained control of your trading actions.
Interface IAction
This interface, IAction, is designed to help you connect your custom logic—like managing a Redux store, logging events, or building dashboards—to the backtesting framework. It acts as a central hub for receiving and reacting to various events triggered during the strategy evaluation process.
Think of it as a set of "hooks" that fire at different points during a backtest or live trade. You can implement these hooks (methods) to customize how the framework interacts with your external systems.
You’ll receive events related to signals (signal, signalLive, signalBacktest), profit/loss adjustments (breakevenAvailable, partialProfitAvailable, partialLossAvailable), scheduling (pingScheduled, scheduleEvent, pendingEvent, pingScheduled, pingActive, pingIdle), risk management (riskRejection), and order execution (orderSync, orderCheck).
Importantly, orderSync and orderCheck use exception-based handling, which means you can throw errors to influence order behavior, while dispose allows you to clean up resources when the framework shuts down. This interface makes it easy to tailor the framework's behavior to your exact needs.
Interface HighestProfitStatisticsModel
This model holds information about the most profitable trading events captured during a backtest. It contains a list of individual events, presented in chronological order with the most recent ones appearing first. You'll also find the total number of profitable events recorded. Think of it as a summary of the best-performing trades within your backtest analysis.
Interface HighestProfitEvent
This represents a single instance where a trading position achieved the highest profit recorded so far. It contains detailed information about that moment, including the exact timestamp when the record was set.
You'll find details like the trading symbol involved, the name of the strategy that generated the trade, and a unique identifier for the signal that triggered it.
The record also stores whether the position was a long or short one, along with the overall profit and loss (PNL) for the position.
Critically, it tracks the highest profit point (peak profit) and the largest drawdown experienced during the position’s life.
Finally, the record provides the price at which the peak profit was achieved, along with the initial entry price, take profit level, and stop loss level. A flag indicates whether this event happened during a backtesting simulation.
Interface HighestProfitContract
This interface describes the information you receive whenever a trading strategy hits a new peak profit. It gives you details like the trading symbol involved (like "BTC/USDT"), the price at that moment, and the exact timestamp of the event.
You'll also see the strategy's name, the exchange it's using, and the timeframe (like a 1-minute chart). The signal data linked to the trade is also included, and a flag tells you whether this update came from a historical simulation (backtest) or live trading.
This allows you to build custom actions, like automatically setting trailing stops or taking partial profits, whenever your strategy reaches certain profit levels. The when property provides the time of the event, which differs depending on whether it's a backtest or a live trade.
Interface HeatmapStatisticsModel
This data structure summarizes the overall performance of your entire trading portfolio, aggregating information from all the individual assets you're tracking. It provides a high-level view of how your portfolio is performing, with key metrics like total profit and loss, Sharpe ratio, and total number of trades.
You'll find averages and extremes, such as the trade-count-weighted average peak and fall profits, as well as durations of winning and losing trades. It also includes advanced risk-adjusted performance metrics like Sortino and Calmar ratios, and an estimate of yearly returns. Think of it as a dashboard that gives you a comprehensive picture of your portfolio's health and efficiency. The structure also incorporates data on consecutive wins and losses, providing insights into the consistency of your trading strategy.
Interface DoneContract
This interface defines what information is available when a background process, either a backtest or a live trading execution, finishes. It tells you which exchange was used, the name of the trading strategy, and the name of the specific timeframe (like a 1-minute or 1-hour chart) involved. You'll also find out whether it was a backtest (simulated trading) or a live trade, the trading symbol like BTCUSDT, and the exact time the process completed. The timestamp will reflect either the end of the last candle processed in a backtest or the time of the last tick received during a live session.
Interface CronHandle
This object, returned when you schedule a task using register, lets you easily cancel that scheduled task. Think of it as a way to "unsubscribe" from a cron job you created. If you no longer need the task to run, using this handle is the straightforward method to remove it from the scheduler, similar to using Cron.unregister. It simplifies the process of cleanup and ensures your scheduled tasks don't run unnecessarily.
Interface CronEntry
This CronEntry defines how and when a particular task or function gets executed within the backtest framework. Each entry has a unique name to identify it, and this name is used to avoid duplicate registrations.
The interval determines how frequently the handler runs; it’s based on candle intervals like "1m," "5m," or "1h." If you skip specifying an interval, the handler will run just once, at the very first relevant tick.
The symbols list acts like a filter. If it's empty, the handler will only execute once across all backtests at each boundary. But if you provide symbols, the handler runs once for each symbol found within the specified interval, giving you a more targeted execution. Symbols themselves also cannot include colons.
Finally, the handler itself is the function that gets executed based on these configured conditions.
Interface CriticalErrorNotification
This notification signals a critical, unrecoverable error within the system. It's a notification type specifically designed to indicate situations that require the process to shut down.
Each critical error notification includes a unique identifier, a human-readable error message to help understand the problem, and detailed error information, including a stack trace and any relevant metadata. The backtest property will always be false, because these errors are related to live execution and not a simulated backtest environment.
Interface ColumnModel
This interface helps you define how data is displayed in tables. Think of it as a blueprint for each column you want to show. You'll specify a unique key to identify the column, a user-friendly label for the header, and a format function to transform your data into a readable string. Finally, isVisible lets you control whether a column appears or not, potentially based on dynamic conditions.
Interface ClosePendingCommitNotification
This notification signals that a pending trade was closed before it fully activated. It provides a comprehensive breakdown of what happened, helping you understand why and how the trade was handled.
Key details include the unique ID of the notification, the exact time it occurred, and whether it happened during a backtest or live trading. You’ll also find information about the specific trading pair, the strategy involved, the exchange used, and the signal's unique identifier.
The notification details the trade’s direction (long or short), the closing price, and the calculated entry price considering any averaging from multiple entries. It also outlines the original and effective take profit and stop loss prices.
You'll find a wealth of information about the trade’s performance, including total entries, partial closes, and the cost of the initial position. The details also extend to key performance indicators like peak profit, maximum drawdown, and percentage profit/loss.
Furthermore, you'll see information about when the signal was created and when the position was activated, plus a potentially helpful note describing the reason for the closure. The final timestamp shows when the notification itself was created. This notification offers a detailed retrospective of a closed pending trade, useful for analysis and optimization.
Interface ClosePendingCommit
This signal signifies the closing of a previously opened position.
It provides details about the closure, including a unique identifier you can supply to track the reason for the closure.
You'll also find key performance metrics associated with the closed position, like its total profit and loss (PNL), the highest profit it reached, and the maximum loss it suffered throughout its lifespan. This gives you a complete picture of the position's journey from opening to closure.
Interface CancelScheduledCommitNotification
This notification signals that a scheduled trading signal has been cancelled before it could be executed. It provides a wealth of details about the cancelled signal, which can be very useful for understanding why a trade didn’t happen.
You'll find information like the unique identifier of the signal, when it was created and when the cancellation occurred. It also includes specifics about the potential trade itself - what the target price was, the planned stop-loss and take-profit levels, and the intended trade direction (long or short).
The notification also captures detailed performance metrics as if the trade had happened, including profit and loss calculations, peak profit, and maximum drawdown. It includes information about how the signal was configured, like if it was part of a backtest or live trading environment and any multipliers applied. Finally, it has a field for a human-readable note that might explain the reason for the cancellation.
Interface CancelScheduledCommit
This interface describes a signal event used to cancel a previously scheduled action. It's used when you want to retract a pending order or instruction.
The action field confirms this is a cancellation request.
You can optionally provide a cancelId to give context to why the cancellation is happening, useful for tracking purposes.
Along with the cancellation, the signal includes information about the associated trade: its total profit and loss (pnl), the highest profit ever reached (peakProfit), and the largest loss experienced (maxDrawdown). These details provide a snapshot of the trade’s performance history leading up to the cancellation.
Interface BreakevenStatisticsModel
This model helps you understand how often your trading strategy reaches breakeven points.
It keeps track of every time your strategy breaks even, storing details about each event in the eventList property – you'll find a list of all the individual milestones.
The totalEvents property simply tells you how many of these breakeven events occurred during the backtest. Essentially, it's a way to monitor and analyze how frequently your strategy resets to a neutral position.
Interface BreakevenEvent
This data structure holds all the essential details whenever a trading signal hits its breakeven point. Think of it as a snapshot of what happened at that specific moment.
It includes things like the exact time, the trading pair involved, the name of the strategy used, and the unique ID of the signal. You’ll also find information about whether it was a long or short position, the current market price, the entry price, and the initial take profit and stop-loss levels.
For strategies that use dollar-cost averaging (DCA), you’ll see details about the number of entries and partial closes. It also keeps track of the original entry and stop loss prices, as well as unrealized profit and loss, and a human-readable note explaining the reason behind the signal. Finally, it records when the position became active and when the signal was originally created, and whether this event occurred during a backtest or live trading.
Interface BreakevenContract
The BreakevenContract represents a significant milestone in your trading strategy – when a signal's stop-loss is moved back to the original entry price. This happens when the price has moved favorably enough to cover any costs associated with the trade.
Think of it as a built-in safety check, indicating that your initial risk has been reduced. This event is carefully managed to ensure it only occurs once per signal, preventing duplicate notifications.
Each BreakevenContract contains a wealth of information:
- The trading pair involved (like BTCUSDT)
- The name of the strategy that generated the signal.
- The exchange and frame being used.
- Detailed signal data, including the original stop-loss price and whether the trade was partially filled.
- The price at which breakeven was achieved.
- Whether it's a backtest or live trading event.
- Precise timestamps for accurate tracking.
This information is useful for services like report generation and also lets you set up custom alerts to monitor your strategy's performance and safety.
Interface BreakevenCommitNotification
This notification signals that a breakeven action has been triggered for a trading position. It provides a wealth of information about the trade, including a unique ID, the timestamp of the event, and whether it occurred during a backtest or live trading.
You'll find details about the symbol being traded, the strategy and exchange involved, and the signal’s unique identifier. It contains crucial pricing information like the current price, entry price, take profit, and stop loss levels, along with their original values before any adjustments.
The notification also gives you the cost of the initial position, the leverage multiplier applied, and details about the position itself – whether it's a long or short trade, and the number of entries and partial closes executed. Extensive data on profit and loss is included, like the total PNL, peak profit, and maximum drawdown, all presented as absolute values and percentages. You can also see the prices used in these calculations and the number of entries associated with peak profit and maximum drawdown.
Finally, there's a field for an optional note explaining the reason for the signal, alongside timestamps indicating when the signal was created, went pending, and when this notification was generated. This comprehensive set of data allows for deep analysis of breakeven events within the trading framework.
Interface BreakevenCommit
The BreakevenCommit represents a signal triggered when a trading strategy adjusts a position to break even. This event provides a snapshot of the position's state at the moment the adjustment occurred.
You'll find key details such as the current market price, the overall profit and loss (pnl) of the trade, and the highest profit (peakProfit) and largest loss (maxDrawdown) experienced so far.
It also includes the original entry price, the intended take profit and stop loss prices (before any trailing adjustments), and the direction of the trade – whether it was a long (buy) or short (sell) position.
The signal creation and activation timestamps (scheduledAt and pendingAt) offer insight into the timing of the event within the strategy's execution flow.
Interface BreakevenAvailableNotification
This notification tells you when a trading signal has reached a point where your stop-loss can be moved to your entry price – essentially, breaking even. It's a great signal that your trade is performing well and reducing your risk.
The notification provides a wealth of information about the trade, including a unique identifier, the exact time it happened, whether it's from a backtest or live trading, the trading pair involved, and the strategy that generated the signal. You'll also see the current market price, your original entry price, the trade direction (long or short), and the current take profit and stop-loss levels.
It also details the trade's performance – how much you've invested, the total profit/loss, peak profit achieved, and the maximum drawdown experienced. You can track the signal's journey with timestamps indicating when it was scheduled, became pending, and when this notification was generated. Finally, a note field might contain an explanation of why the signal was triggered.
Interface BeforeStartContract
This interface, BeforeStartContract, signals the beginning of a trading strategy run. It's a crucial event that happens right before the strategy starts processing data, allowing you to perform setup tasks like opening log files or initializing variables. You're guaranteed to see this event once per strategy run, and it’s always followed by an AfterEndContract event, ensuring a clear start and end for each run. If errors occur within the listener for this event, they won't interrupt the trading process but will be handled separately.
The symbol property tells you which asset the strategy is trading, and strategyName identifies the specific strategy being used. You’ll also find the exchangeName and frameName which help you understand the context of the trading run. The backtest flag indicates whether the run is a historical simulation or live trading. The currentPrice provides a convenient snapshot of the market price at the run's start.
The when property represents the intended start time – in backtesting, this is the planned start of the historical data, while in live trading, it's the current time. The timestamp is simply a numerical representation of the when property.
Interface BacktestStatisticsModel
This model holds all the important statistical results after running a backtest. It gives you a detailed breakdown of how your trading strategy performed.
You'll find information like the total number of trades, how many were winners versus losers, and key performance indicators such as win rate and average profit per trade.
It also provides more advanced metrics like Sharpe Ratio and Sortino Ratio, which consider risk and help you compare strategies. You can also see how long trades typically lasted, and how much pressure buyers and sellers exerted on the market.
The data includes details about consecutive winning or losing streaks, and even helps you understand overall market trends with metrics like trend strength and confidence. If any calculations resulted in potentially unreliable values (like division by zero), those corresponding fields will be null.
Interface AverageBuyCommitNotification
This notification lets you know when a new averaging (DCA) order has been added to an existing trade. It provides a wealth of details about the trade, including when it happened, the trading pair involved, and which strategy generated the signal. You'll see information like the current price, the cost of the averaging order, and how it impacts the overall average entry price.
The notification also gives you a comprehensive picture of the trade's performance so far. This includes metrics like peak profit, maximum drawdown, and the overall profit or loss, all expressed in both percentages and USD. You can track the trade's journey from its initial entry to its current state, observing how factors like trailing stop-losses or take-profit orders have adjusted prices.
Finally, the notification includes details like signal creation time, pending time and any notes associated with the trade, offering a complete record of the position's history. It’s particularly useful for understanding how DCA is impacting your positions and how they are performing.
Interface AverageBuyCommit
This event, called AverageBuyCommit, signifies that a new purchase has been made to average out the price of an existing position. It's triggered whenever a new averaging entry is added, like in a dollar-cost averaging (DCA) strategy.
The event provides detailed information about the transaction. You'll find the price at which the new averaging buy was executed, the cost of that specific purchase, and the overall effective (averaged) entry price for the position.
Crucially, the event also includes performance metrics like unrealized profit and loss (PNL), the highest profit achieved so far, and the maximum drawdown experienced. It also reports the original entry price, as well as any adjusted take profit and stop-loss levels. The timestamps of when the signal was created and the position was activated are also included for comprehensive tracking.
Interface AfterEndContract
This interface signals the end of a strategy execution run, offering a chance for cleanup and finalization tasks. Think of it as a guaranteed goodbye message after a trading strategy has finished its work, whether it completed normally, encountered an error, or was stopped prematurely.
It's paired with a BeforeStartContract event, guaranteeing that you'll receive one AfterEndContract for every starting event. This ensures a clean sequence of events. Any errors that occur while handling this event are automatically managed, preventing disruptions to your code.
The when property tells you precisely when the run finished: in backtesting, it's the time of the last candle processed; otherwise, it's the current time aligned to the nearest minute. The timestamp property provides the same time as a numerical value, which can be useful for logging or transferring data.
You’ll find key information included, like the trading symbol, strategy name, exchange, and frame used, allowing you to easily identify and categorize the event. A convenient currentPrice property offers a readily available average price, avoiding the need to fetch it from the exchange separately. The backtest flag simplifies logic based on whether it's a backtest or live run.
Interface ActivePingContract
This describes a special notification, called an "Active Ping," that the system sends out regularly while it's monitoring a pending trade signal. Think of it as a heartbeat to let you know the signal is still active and hasn't been closed yet.
Each ping contains detailed information about the signal, including the trading pair (like BTCUSDT), the name of the strategy that created it, and the exchange it's on. You'll also find the timeframe being used and all the original data associated with the signal, such as the take-profit and stop-loss prices.
The ping also provides the current market price at the time of the ping, allowing you to build custom logic to react to price movements. You can tell if the ping comes from a historical backtest or from live trading.
Finally, you'll get a timestamp and a date object that indicates exactly when the ping was generated—in live mode it’s wall-clock time, and in backtest mode it’s the time of the historical candle being analyzed. You can register a listener to receive these ping notifications, allowing you to build custom management logic based on the signal’s status.
Interface ActivateScheduledCommitNotification
This notification signals that a scheduled trading signal has been activated, meaning it's been put into action. It’s essentially a confirmation that the system has started executing a trading plan you've set up in advance.
The notification includes a lot of details about the trade, such as a unique ID, the exact time of activation, and whether it's happening in a simulated backtest or live trading environment. You'll find information about the trading pair (like BTCUSDT), the strategy that triggered the signal, and the exchange being used.
It also provides key specifics about the position itself: the direction (long or short), the entry price, take profit and stop-loss levels, and details about any averaging (DCA) or partial closing that may have occurred.
You’ll get a complete picture of the trade's potential financial performance, including cost, leverage, profit/loss, percentage gains/losses, and peak profit/drawdown metrics. There's even information about the prices at which the peak profit and maximum drawdown were achieved.
Finally, the notification includes timestamps for the signal's creation and when it entered a pending state, along with the current market price at the time of activation and an optional note explaining the reason for the signal.
Interface ActivateScheduledCommit
This data structure represents an action that activates a previously scheduled trading signal. It provides detailed information about the trade that's being executed, including the direction (long or short), entry price, and the prices for take profit and stop loss – both the original values and those adjusted by trailing stops. You'll find key performance metrics like total profit and loss (PNL), peak profit achieved, and the maximum drawdown experienced by the position. It also records the timestamp when the signal was initially created and the time the position actually started executing. An optional field allows you to include a user-defined identifier for tracking activation reasons.